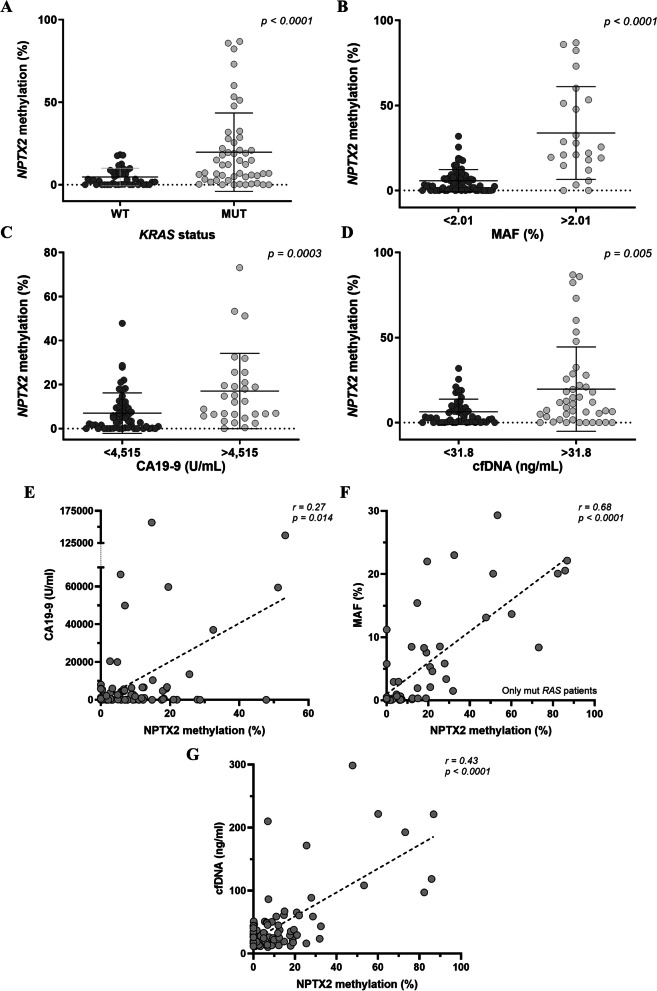
Fig. 2.
Association of circulating NPTX2 methylation with other circulating tumor biomarkers in mPDAC. A–D Plasma NPTX2 methylation levels according to their RAS status (A), RAS mutant allele fraction (MAF) (B), CA19-9 (C) and cfDNA concentration (D) cut-off values, which were set at 2.01% for RAS MAF, 4515 U/mL for CA19-9 and 31.8 ng/mL for cfDNA concentration. Data are shown as mean ± SD for each group. NPTX2 was significantly more methylated in those samples with mutated RAS, with a higher MAF of RAS, with higher CA19-9 values and with higher cfDNA concentration. E–G Correlation analysis of circulating NPTX2 methylation with CA19-9 levels (E), MAF value (F) and cfDNA concentration (G)

