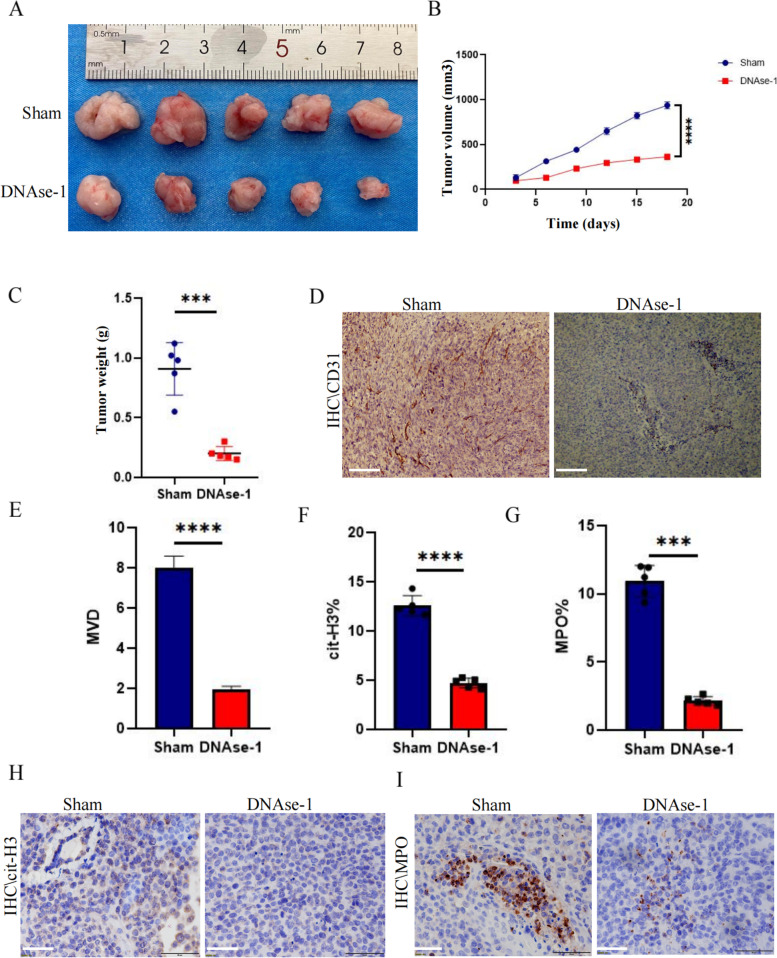
Fig. 3.
DNase-1 inhibited tumor growth in relation to a decrease in microvessel density. a Subcutaneous tumor samples from nude mice treated with DNase-1 and the control group (n = 5). b Growth curve of subcutaneous tumor in nude mice; all values are presented as means ± SDs. ****p < 0.0001. c Subcutaneous tumor sample weights; all values are presented as means ± SDs. ***p < 0.001. d Microvessel densities in tumor tissues of the control and DNase-1 treatment groups as assessed by immunohistochemical staining. CD31 is a positive index; magnification × 20; scale bars: 50 μm. e The microvessel density was calculated using Image J software; all values are presented as means ± SDs, ****p < 0.0001. h, i The levels of NETs in tumor tissues of the control and DNase-1 treatment groups were measured via immunohistochemical staining. cit-H3 and MPO are positive markers; magnification × 20; scale bars: 50 μm. f, g Statistics of the NET coverage area were calculated using Image J software. NET, neutrophil extracellular trap; MPO, myeloperoxidase; cit-H3, citrullinated histone H3; SD, standard deviation

