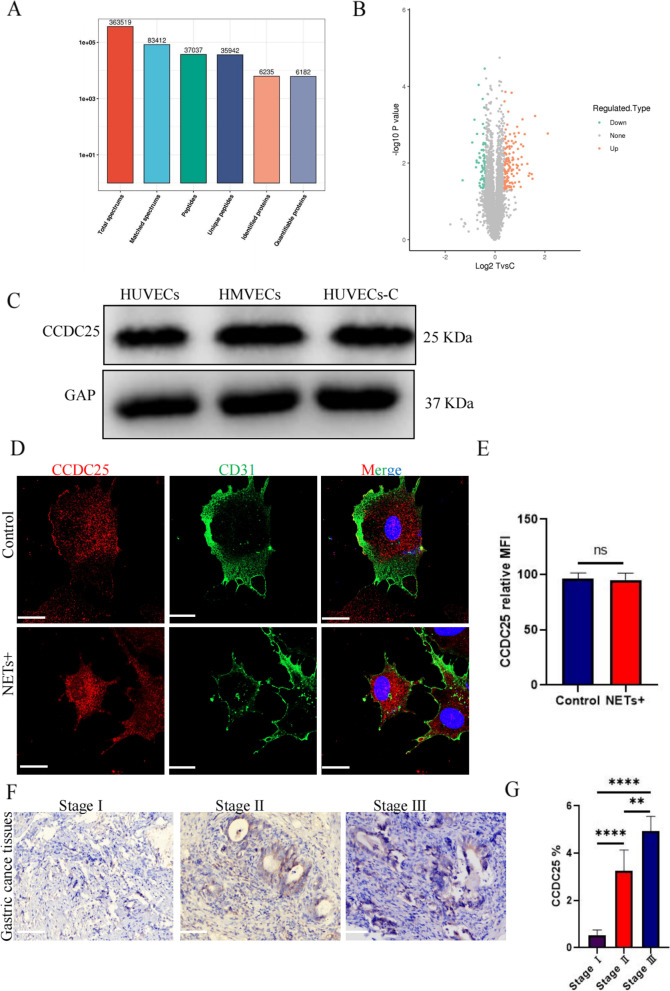
Fig. 4.
HUVECs express CCDC25, as evaluated using proteomics a The quantifiable proteins differentially expressed after NET stimulation of HUVECs were identified from TMT-MS/MS spectra. b Volcanogram of changes in relative protein abundance between NET-stimulated and unstimulated groups. c The expression of CCDC25 in different endothelial cells, HUVECs, HUVECs-C, and HMVECs, as detected by western blotting. d Differences in the expression and location of CCDC25 before and after NET stimulation as observed via immunofluorescence. e The average fluorescence intensity of CCDC25 was calculated using Image J software. f The expression of CCDC25 in stage I, II, and III gastric cancer tissues was observed by immunohistochemical staining. g The area covered by CCDC25 expression in immunohistochemical staining. Magnification, × 20; scale bars: 50 μm; red, CCDC25; green, CD31; blue, DAPI. All values are presented as means ± standard deviations. **p < 0.01; ****p < 0.0001 CCDC25, coiled-coil domain containing 25; HUVEC, human umbilical vein endothelial cell; HMVEC, human pulmonary microvascular endothelial cell; NET, neutrophil extracellular trap; HUVEC-C, human pulmonary microvascular endothelial cell line

