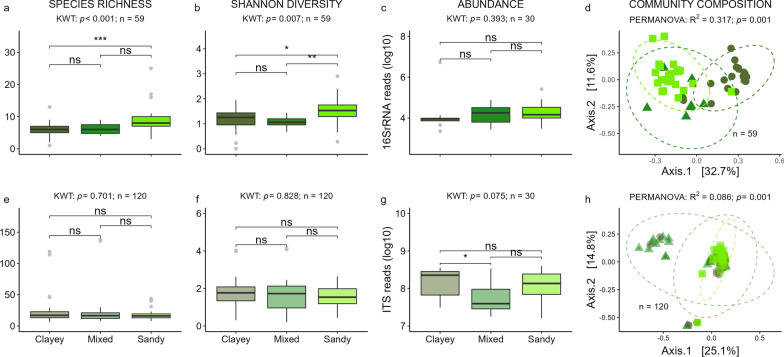
Fig. 2.
Effect of soil microbiome on phyllosphere microbiomes. Bacterial (top, a–d) and fungal (bottom, e–h) species richness (a, e), Shannon diversity (b, f), abundance based on qPCR of 16S rRNA (c) and ITS read counts (g), and community composition (d, h). Box plots show the median (horizontal line), the lower and upper bounds of each box plot denote the first and third quartiles and whiskers above and below the box plot show 1.5 times the interquartile range. Points located outside of the whiskers (grey) represent outliers. Ordination plots of bacterial (d) and fungal h community composition based on Bray–Curtis dissimilarity index with corresponding colors (phyllospheres from clayey soil samples: olive circles; mixed: medium green triangles; sandy: lime green squares). X-axes labels of top boxplots a–c correspond to x-axes labels of lower boxplots (e–g). Results of global statistical analyses for the factor ‘soil community’ (a–c and e–g: Kruskal–Wallis test; d and h: PERMANOVA) are displayed above each panel, FDR-corrected p-values of pairwise comparisons (Wilcoxon signed-rank test) for alpha diversity differences and abundance a–c, e–g added within the graph (*p < 0.05; **p < 0.01; ***p < 0.001; ns not significant). KWT Kruskal–Wallis test

