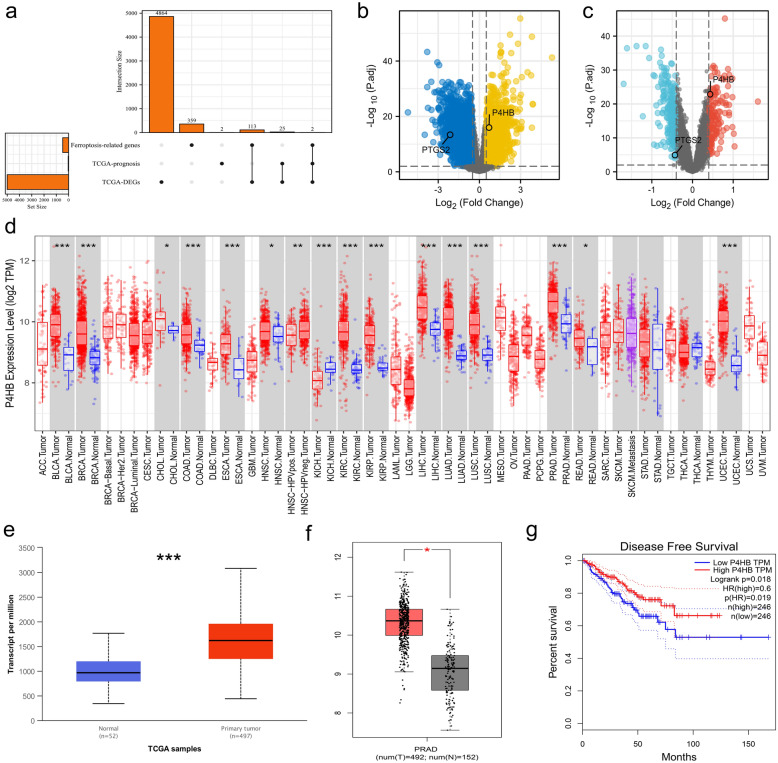
Fig. 2.
Process of screening P4HB. a Upset plot shwnig the intersection of DEGs, prognosis-related genes and ferroptosis-related genes; b volcano plot showing the expression of P4HB and PTGS2 between tumor and normal samples in the TCGA database; c volcano plot showing the expression of P4HB and PTGS2 between tumor and normal samples in the GEO data sets; d bar graph showing the expression of P4HB between tumor and normal samples at pan-cancer level; e bar graph showing P4HB expression between tumor and normal samples in the UALCAN database; f bar graph showing P4HB expression between tumor and normal samples in the GEPIA database; g Kaplan–Meier curve showing the survival differences of high and low P4HB expression using GEPIA database. DEGs differentially expressed genes, TCGA the cancer genome atlas, GEO gene expression omnibus

