
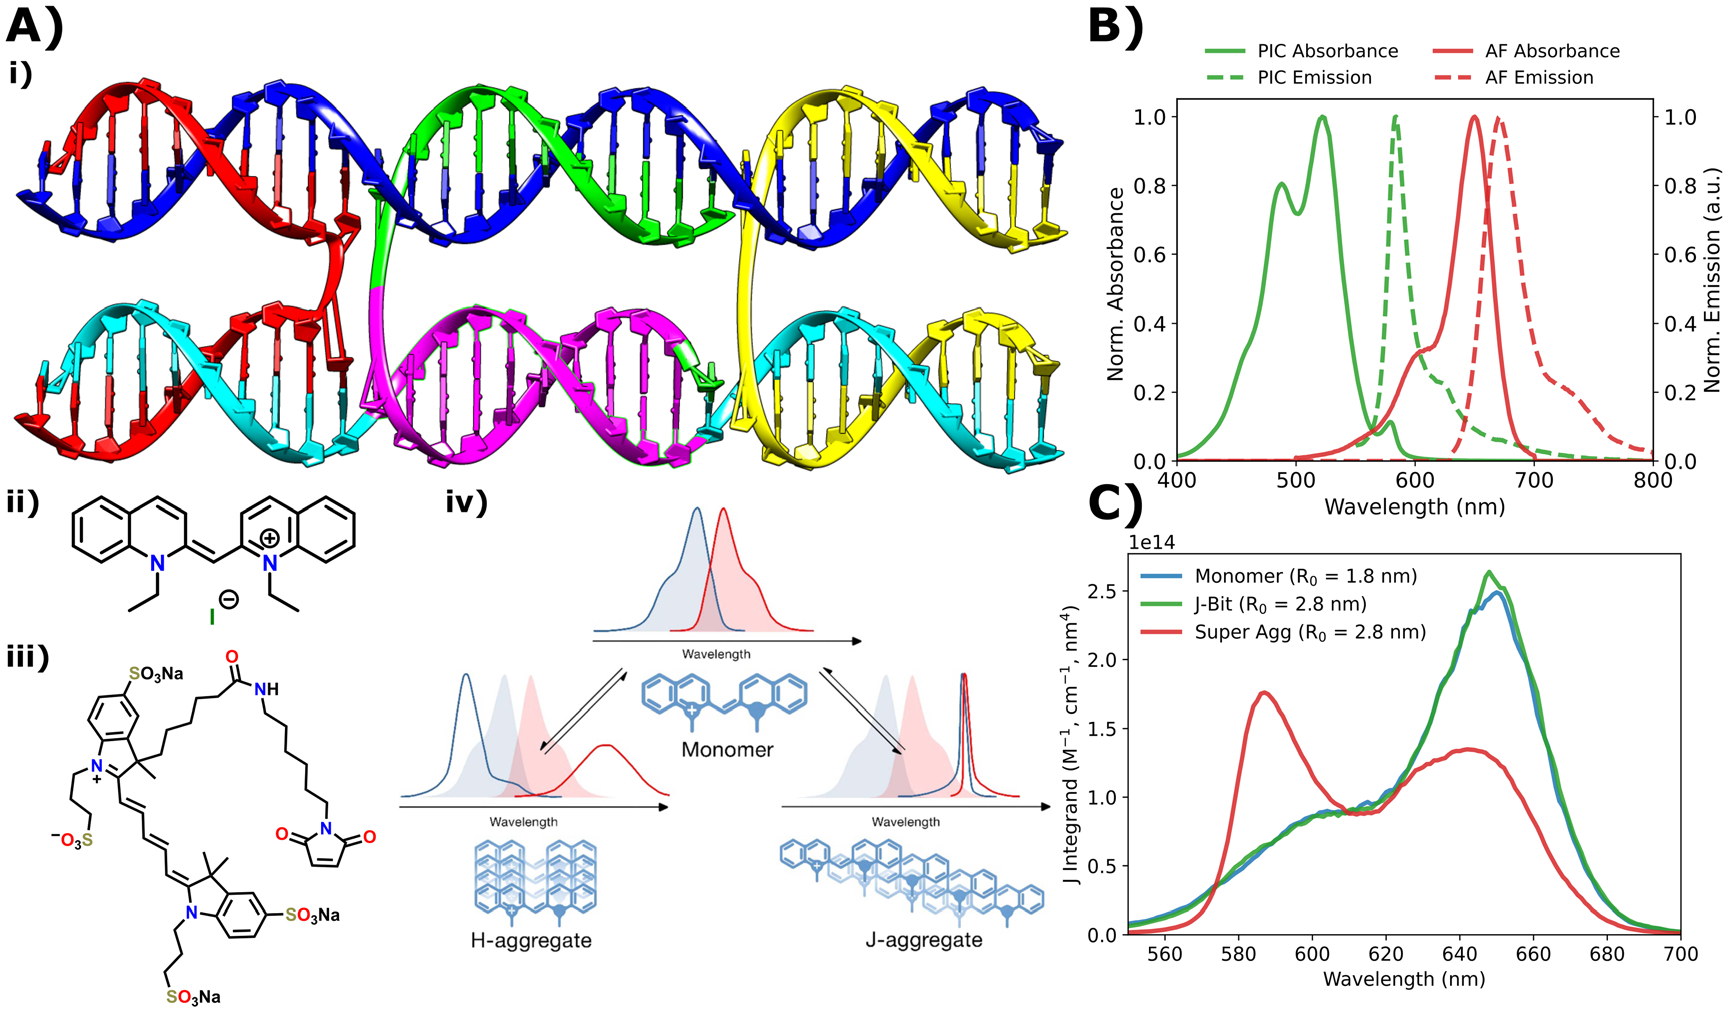
Figure 1.
DNA nanostructure schematics and dye component properties. (A) (i) A molecular model representation of the DX-tile nanostructure self-assembled from five color coded component strands. The purple region denotes the AT- or GC-track regions. For full DNA strand sequences see the SI figures S1–4. (ii) Chemical structure of PIC dye. (iii) Chemical structure of AlexaFluor™ 647-maleimide. (iv) Schematic representation of structural models for cyanine dye H- and J-aggregation along with the characteristic spectral changes. These are provided as visual guides to the reader and do not necessarily represent the SA structures. Panel modified from [49]. (B) Normalized absorbance (solid) and emission (dashed) spectra of SA (green) and AF (red) dye components. For monomer and J-bit spectra, see the SI. (C) Spectral overlap integrand plotted as a function of wavelength for the donor species PIC monomer (blue), J-bit (green), and SA (red) and an AF acceptor dye. The estimated R0 values are reported in order to differentiate between the expected transfer efficiency of the monomer and J-bit species. Reproduced from [49]. © IOP Publishing Ltd. All rights reserved.