
Figure 2.
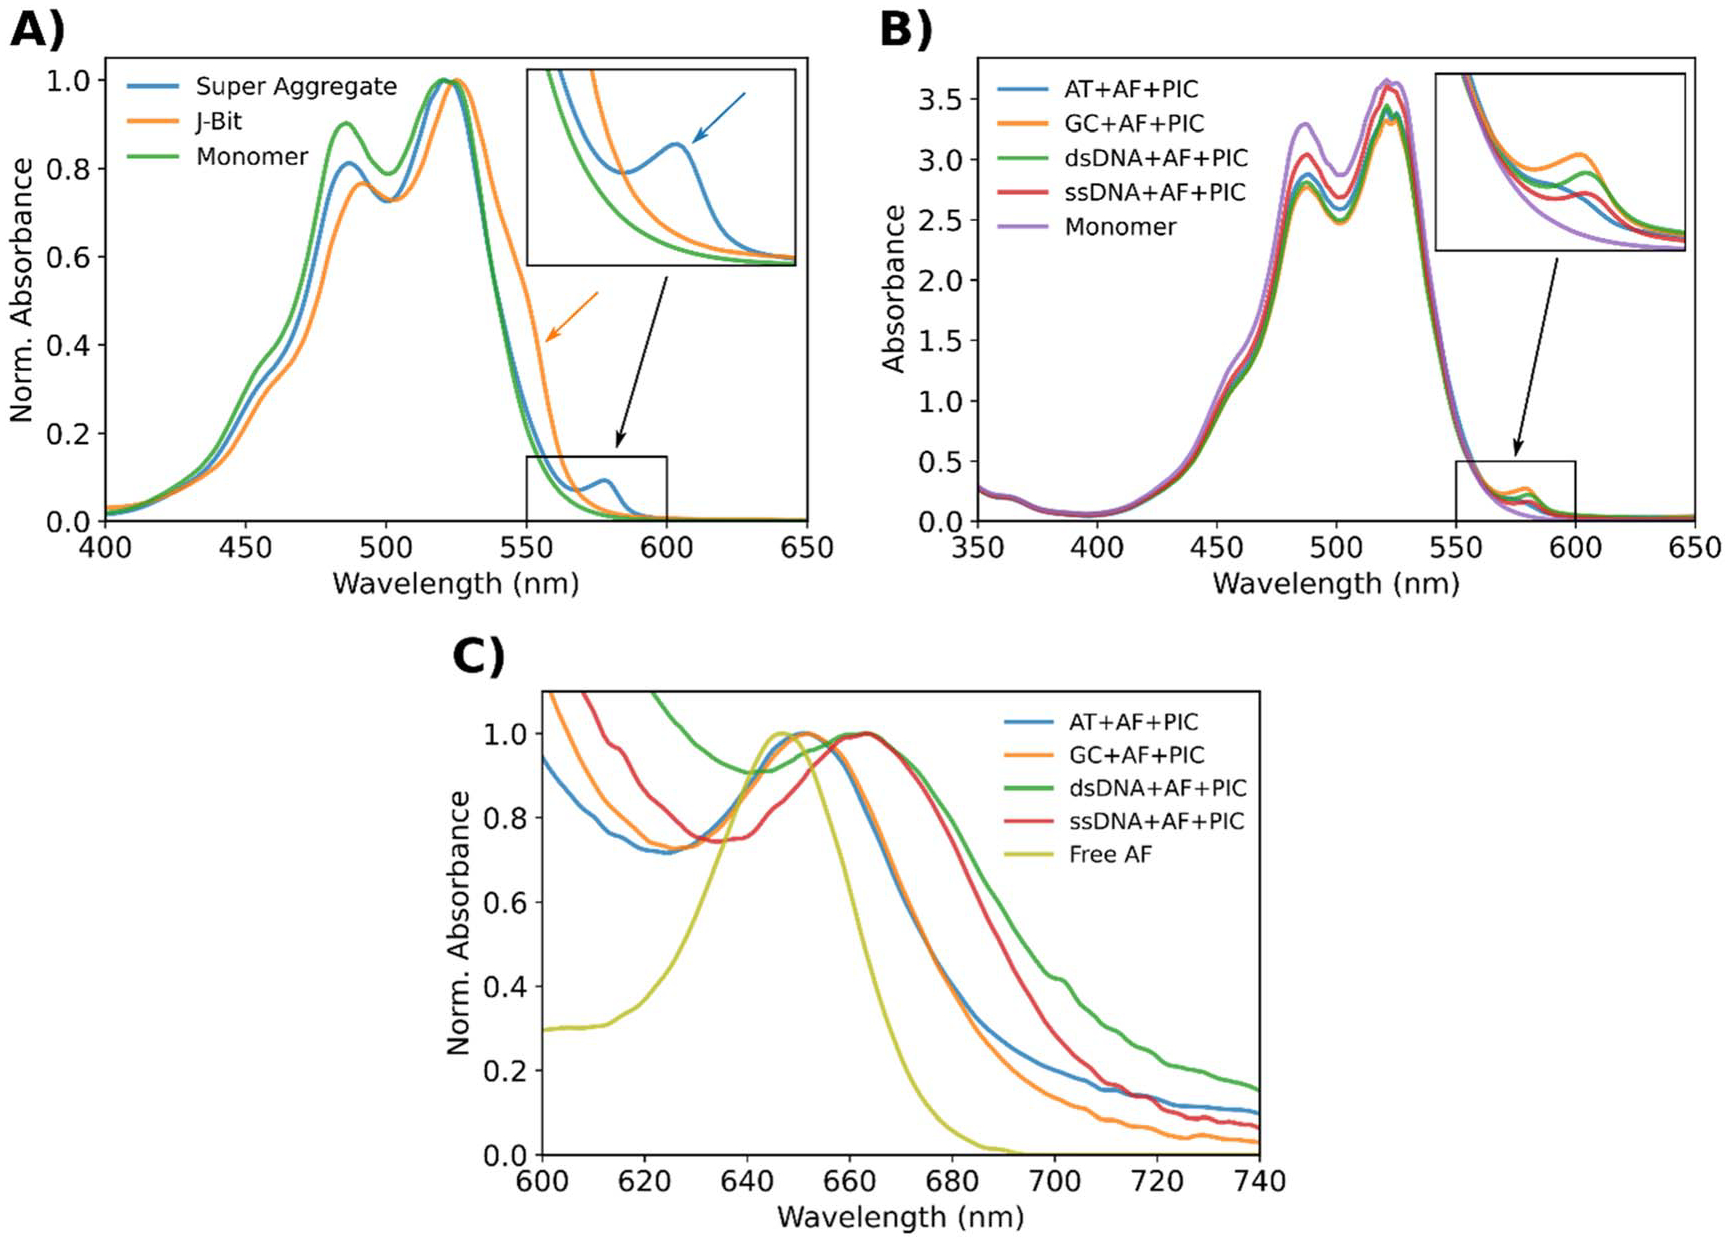
Absorbance features characteristic of SA formation. Except for the J-bit, each of these samples were formed by mixing 160 μM PIC dye with 500 nM DNA normalized to the dye labeled strand concentration. The J-bit sample was formed in the AT nanostructure by mixing with 60 μM PIC dye. (A) Normalized absorbance spectra of PIC SA (blue), J-bit (orange), and monomer (green). The color-coded arrows highlight the characteristic features which differentiate J-bit (555 nm shoulder) from the SA (580 nm peak). Inset is a magnification of the black box region. (B) Absorbance spectra of SA formed in an AT (blue), GC (orange), dsDNA (green), and ssDNA (red) nanostructures. The SA absorbances are presented relative to a PIC only control (purple), which is considered representative of a monomeric population. Inset is a magnification of the black box region. (C) Normalized absorbance spectra of DNA + AF + PIC samples with spectra centered on the AF absorbance band. The color-coded curves are presented relative to the Free AF control which is to highlight the red shifting and linewidth broadening.