
Figure 3.
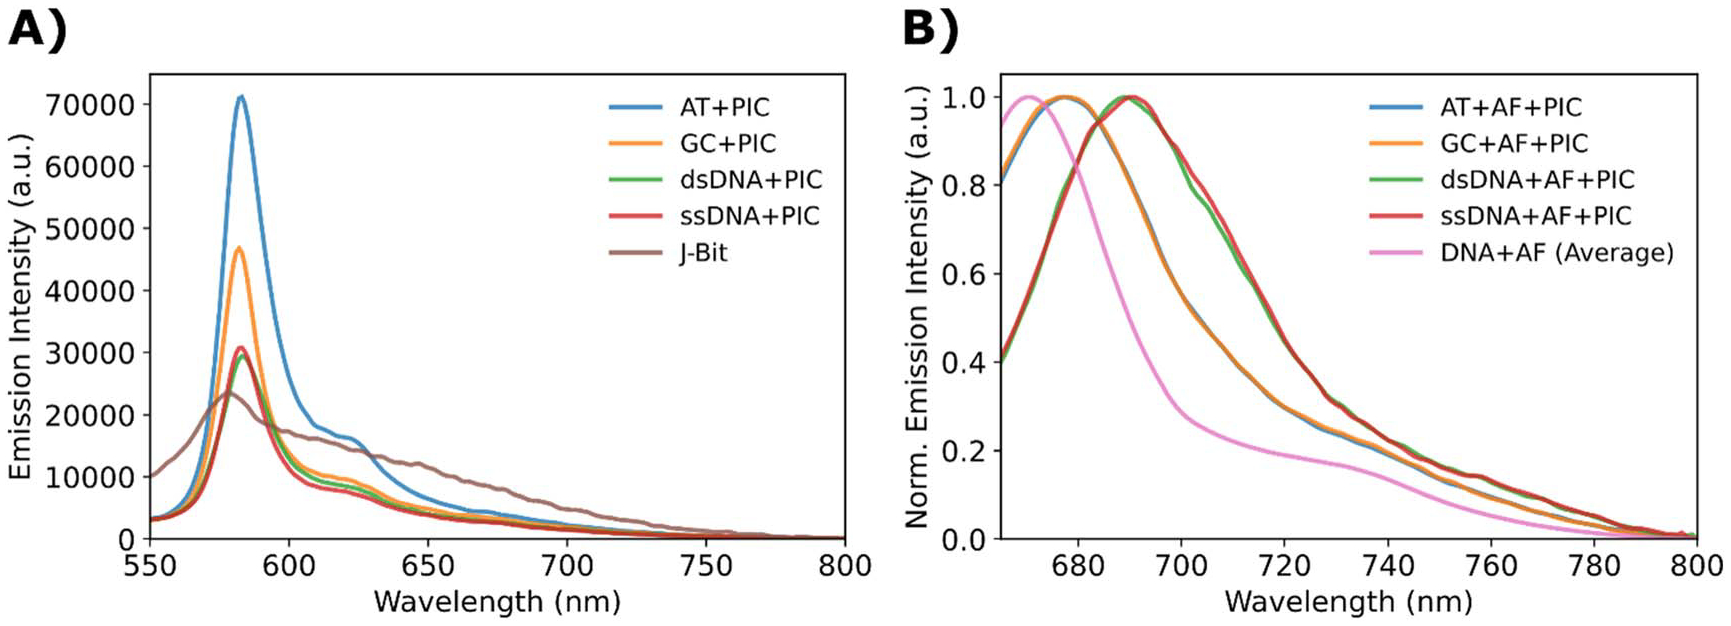
Fluorescence emission spectra of directly exciting dye components. (A) Fluorescence emission spectra of DNA + PIC samples in response to 523 nm excitation. The color-coded curves are presented relative to the emission of J-bit formed in the AT nanostructure (brown). (B) Normalized fluorescence emission spectra of DNA + AF + PIC samples in response to 647 nm excitation. The color-coded curves are presented compared to the non-SA (DNA + AF) controls of the four DNA substrates averaged together.