
Figure 4.
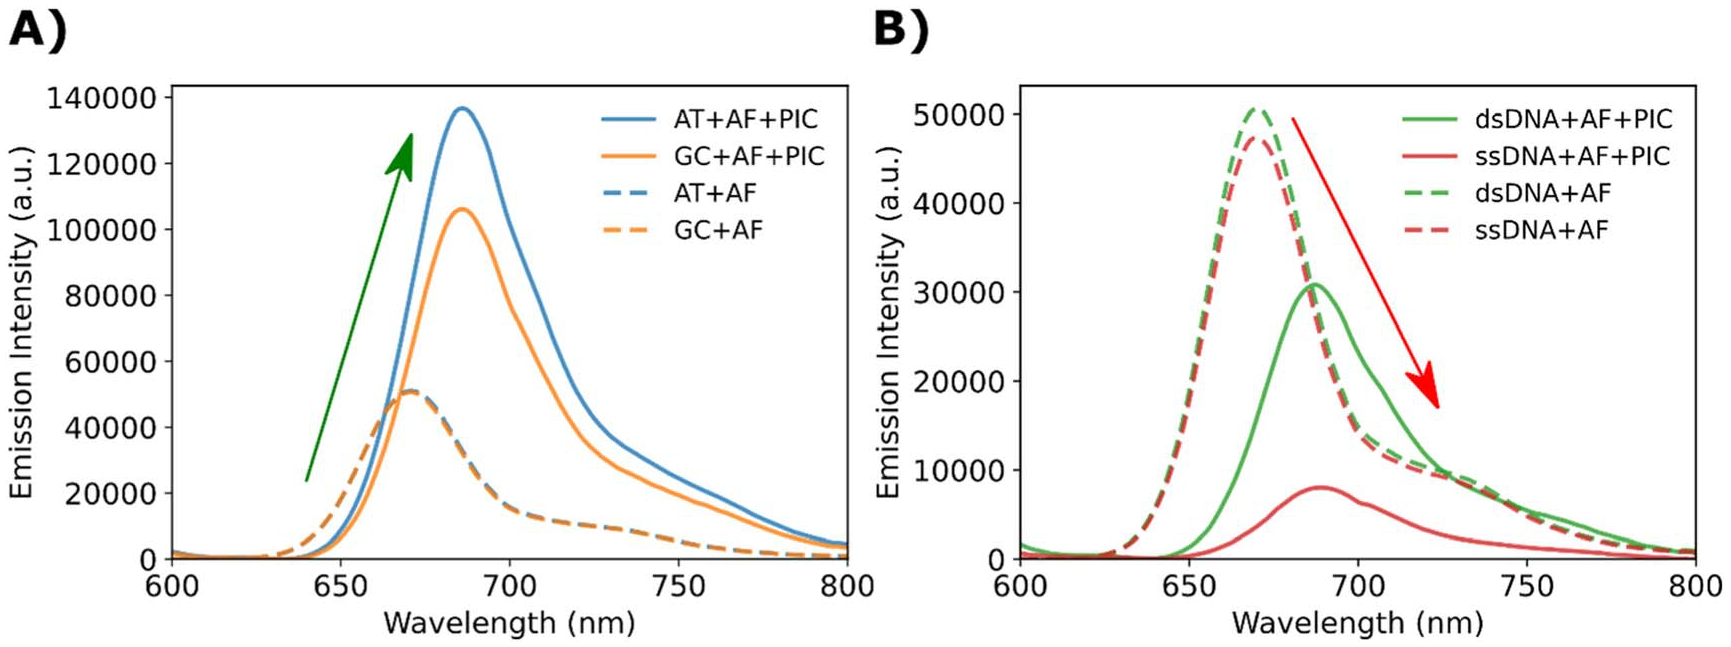
SA excitation in the presence of AF and subsequent energy transfer. (A) Fluorescence emission spectra of DX-tile (DNA + AF + PIC) samples in response to 580 nm excitation. The color-coded curves are presented relative to the corresponding PIC lacking controls (DNA + AF). (B) Fluorescence emission spectra of non-DX-tile (DNA + AF + PIC) samples in response to 580 nm excitation. The color-coded curves are presented relative to the corresponding PIC lacking controls (DNA + AF).