
Figure 5.
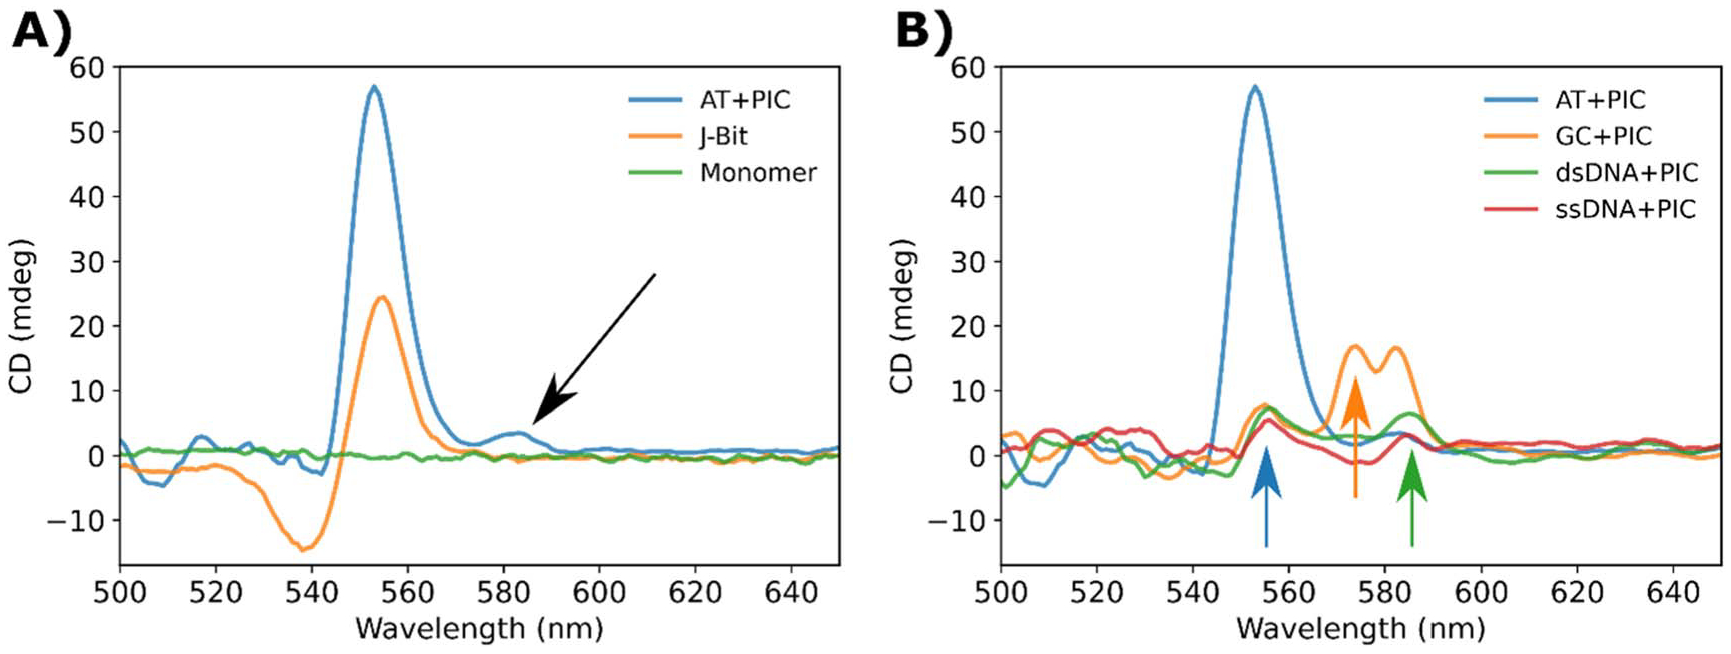
CD spectra of SA. (A) CD spectra of PIC SA (blue), J-bit (orange), and monomer (green). The black arrow highlights an emergent positive peak located at approximately 580 nm. (B) CD spectra of SA formed in an AT (blue), GC (orange), dsDNA (green), and ssDNA (red) nanostructures.