
Figure 6.
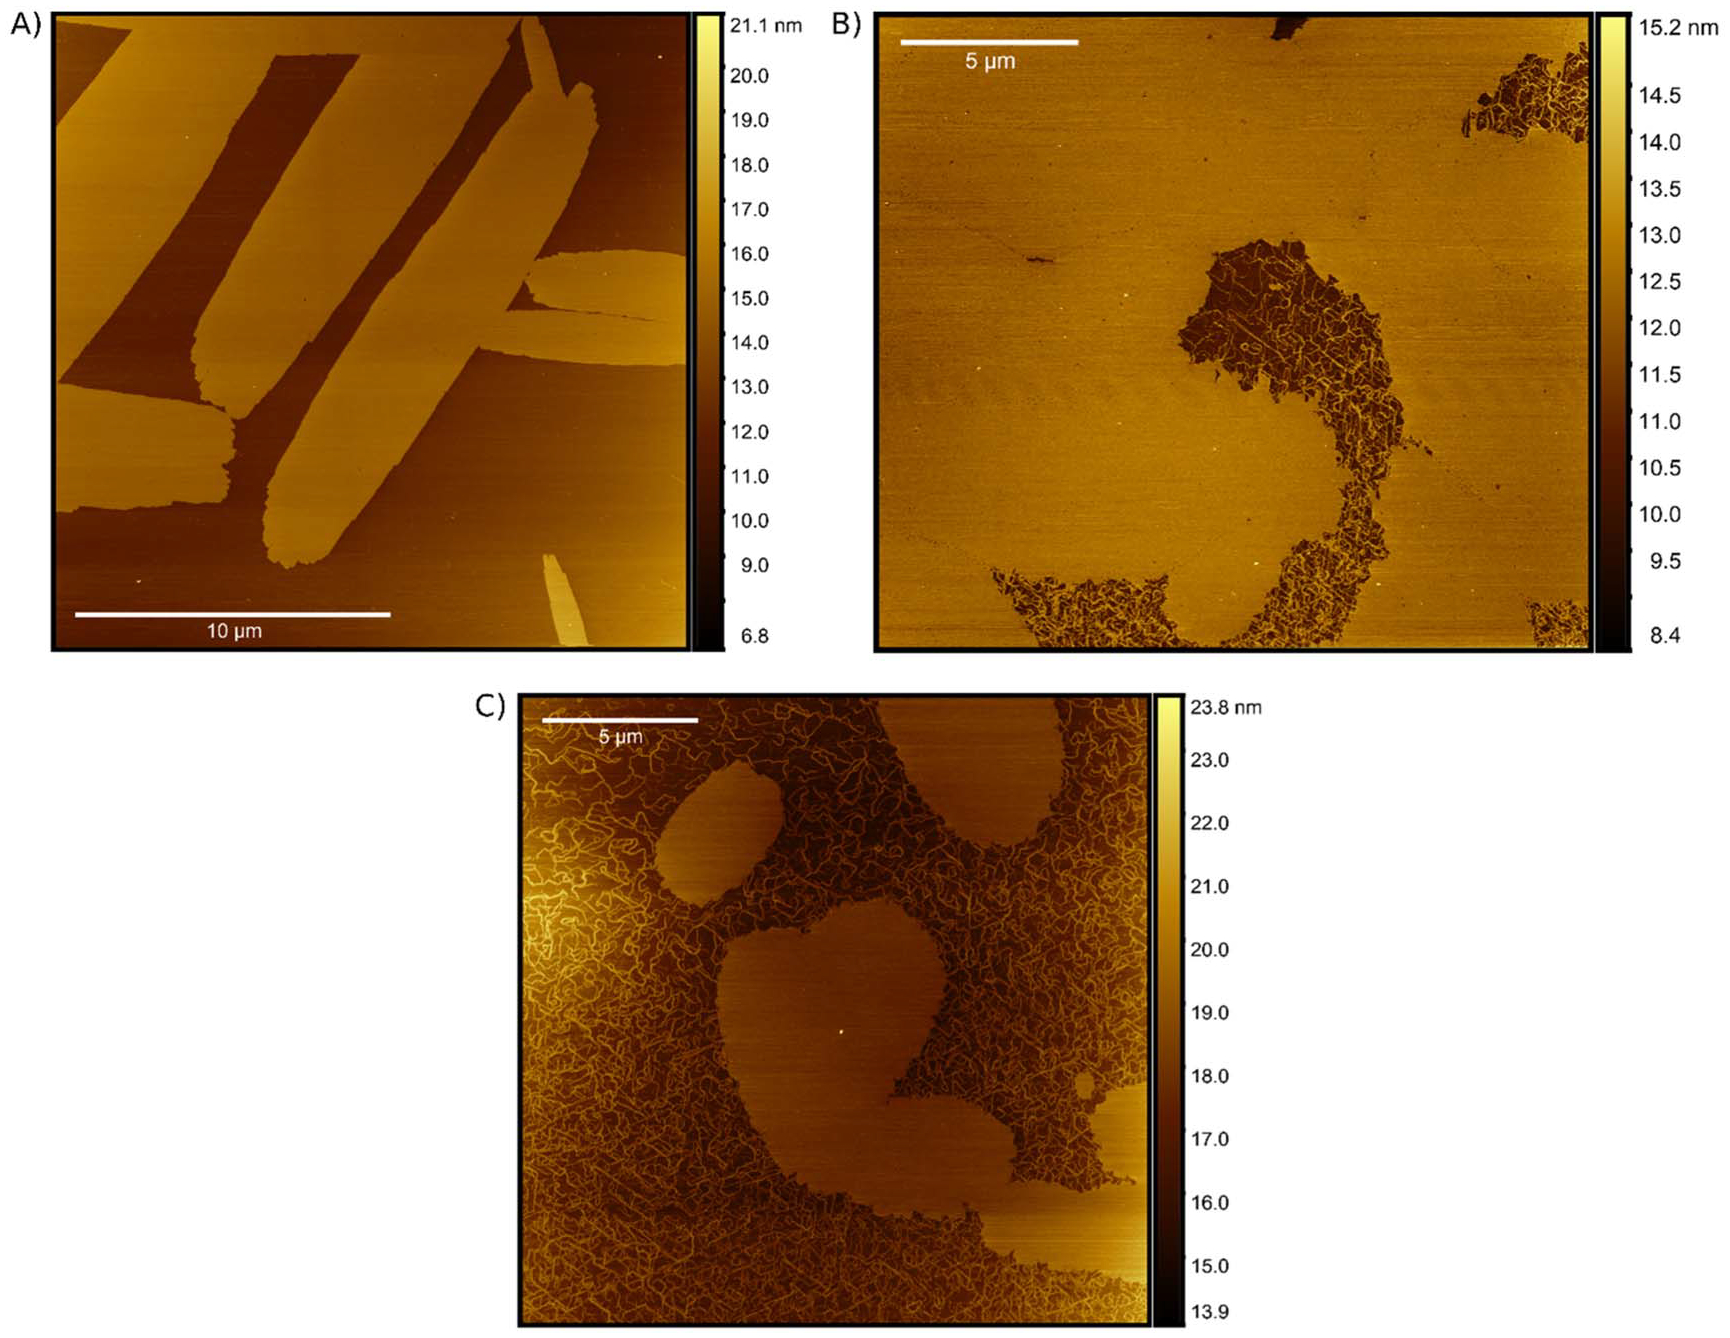
AFM visualization of SA formations. AFM visualizations of PIC aggregates formed in the (A) AT, (B) dsDNA, and (C) ssDNA nanostructures. Each of the samples was formed immediately before measurement by mixing 160 μM PIC dye with 500 nM DNA normalized to the dye-labeled strand concentration (i.e. 320-fold excess).