
Figure 1. Statistics about D/E-PARylated proteins and their interactions with other proteins.
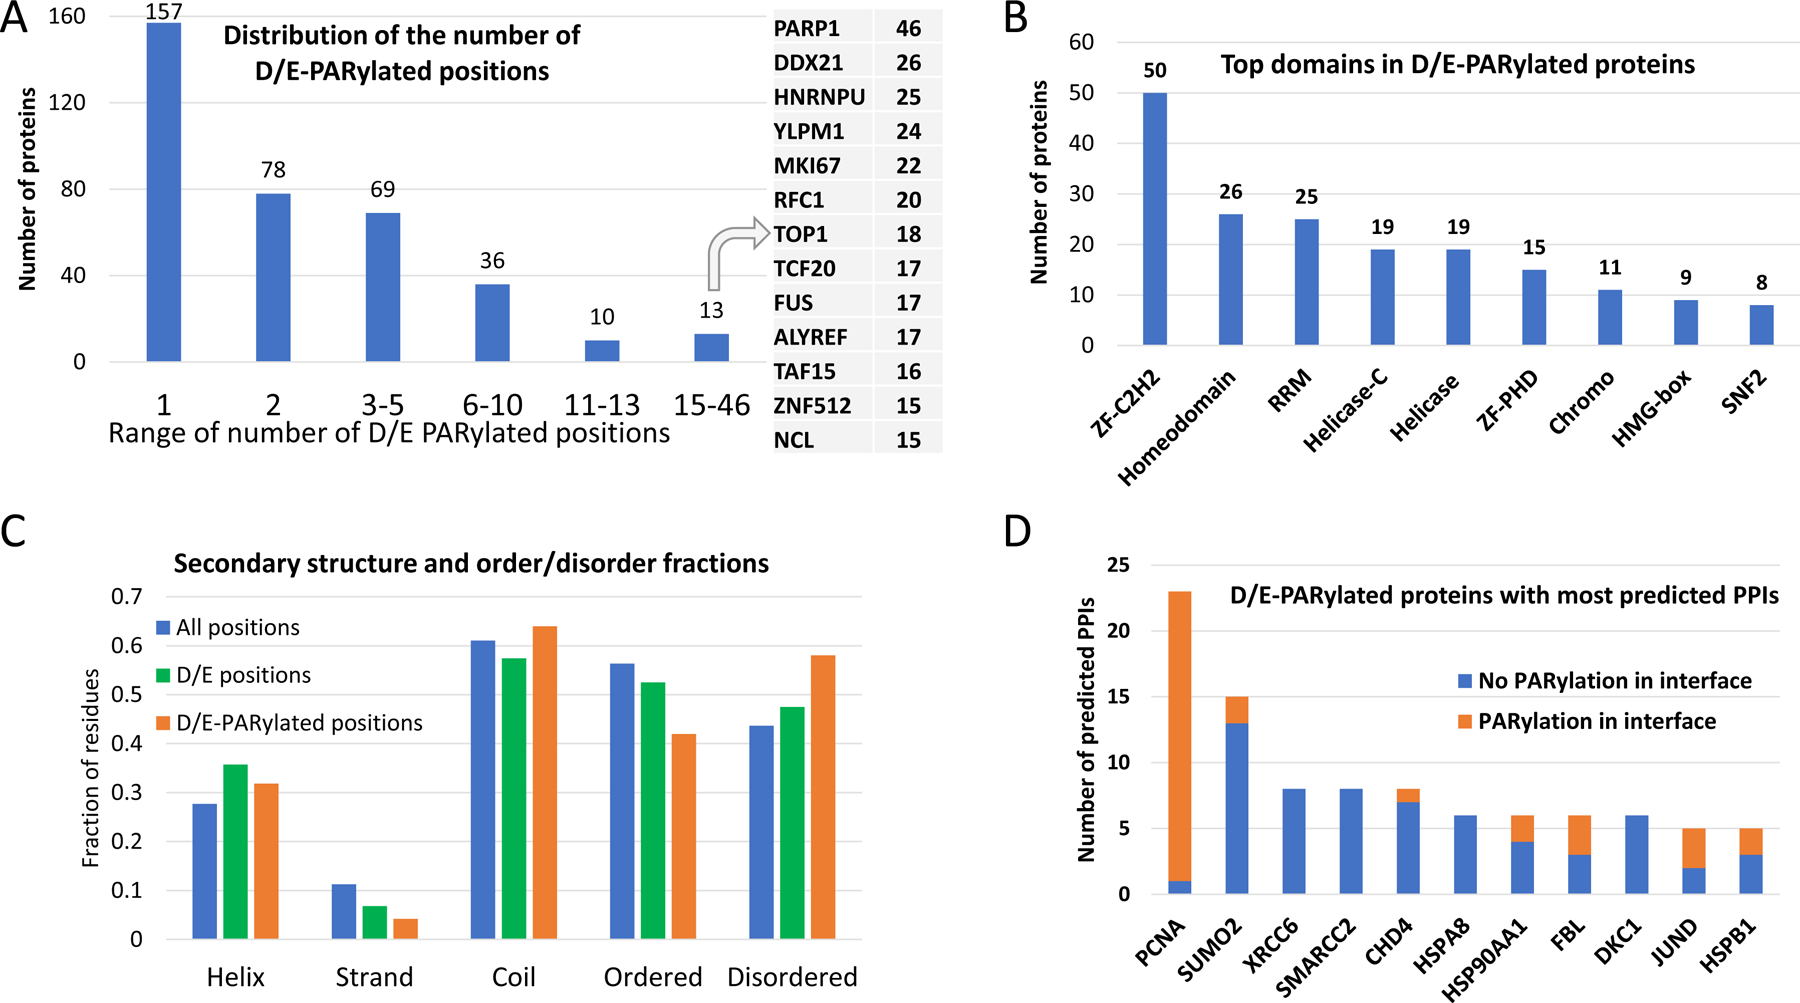
(A) Distribution of the number of D/E-PARylation sites among D/E-PARylated proteins. Proteins with the largest numbers of D/E-PARylation sites are listed to the right. (B) Frequently observed domains among D/E-PARylated proteins. ZF-C2H2 - C2H2 type zinc finger domain, ZF-PHD: PHD-type zinc finger domain, RRM -RNA recognition motif. (C) Secondary structure contents and ordered/disordered states of PARylated proteins and PARylation sites. The blue, green and orange bars show fraction of different secondary structure and order/disorder states of all positions in PARylated proteins, positions with D/E, and D/E-PARylation sites, respectively. Statistical significance of comparing the fractions is indicated by the number of stars: 4 stars - p-value<0.00001, 3 stars - 0.00001<p-value<0.0001, 2 stars - 0.0001<p-value<0.001, and 1 star - 0.01<p-value<0.04. (D) D/E-PARylated proteins with the largest numbers of predicted PPIs. The orange and blue portions of the bars correspond to PPI interfaces with and without D/E-PARylation sites, respectively.