
Figure 2. Clusters of D/E-PARylated proteins and their interaction partners.
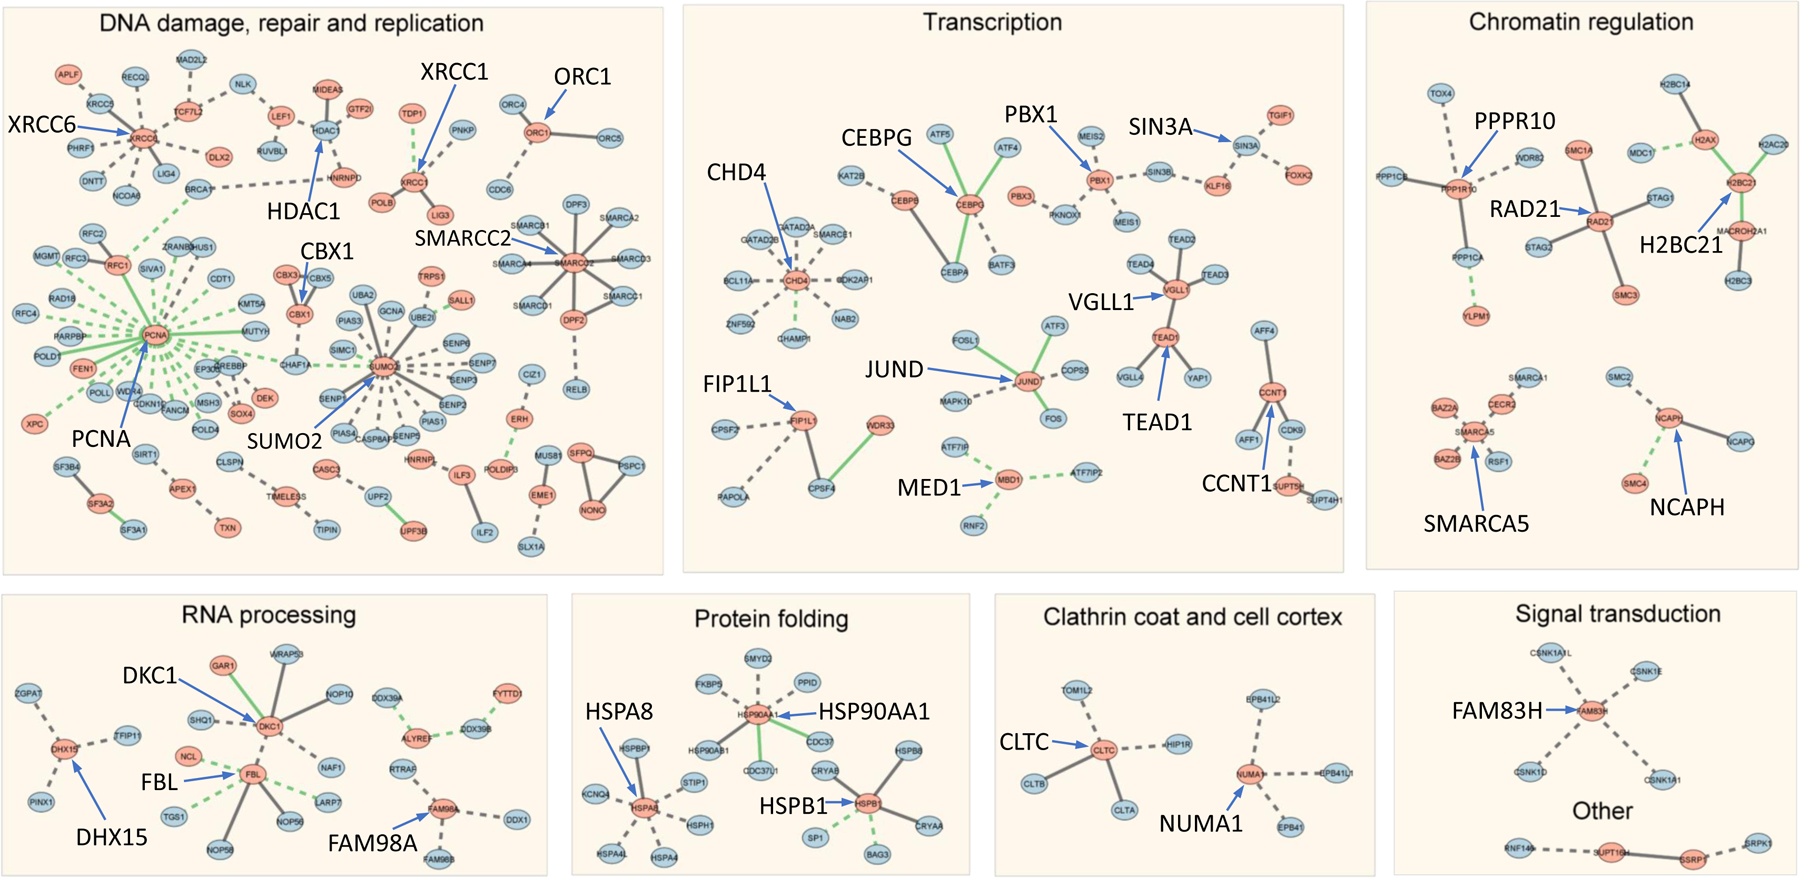
Dots represent proteins and edges connect proteins that are predicted to interact (AlphaFold contact probability > 0.9). Clusters are labeled by the predominant functional category. Solid lines represent interactions with experimental structures. Dashed lines represent interactions without experimental structures. Green lines represent interactions where PARylation sites are mapped to the PPI interfaces.