
Figure 1.
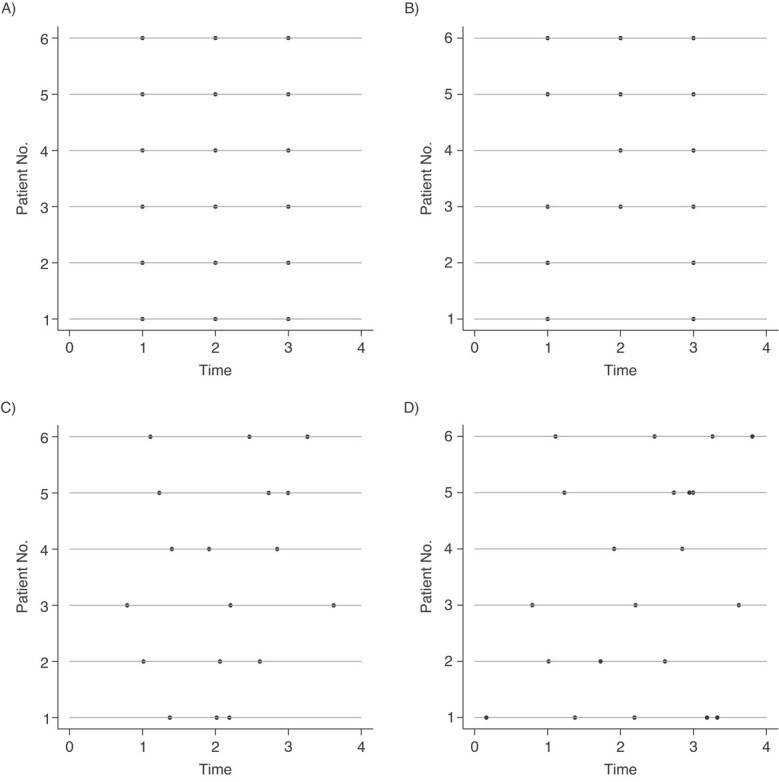
Irregular versus missing data. Each panel shows hypothetical data from 6 patients in a randomized trial with 3 scheduled assessment times. The horizontal lines represent patients and the dots represent assessment times for each patient. (A) Repeated assessments with no variation around the intended assessment times. (B) Repeated assessments subject to missingness. (C) Variation around the intended assessment times is shown. (D) Variation around the intended assessment times, missingness, and additional assessments is shown.