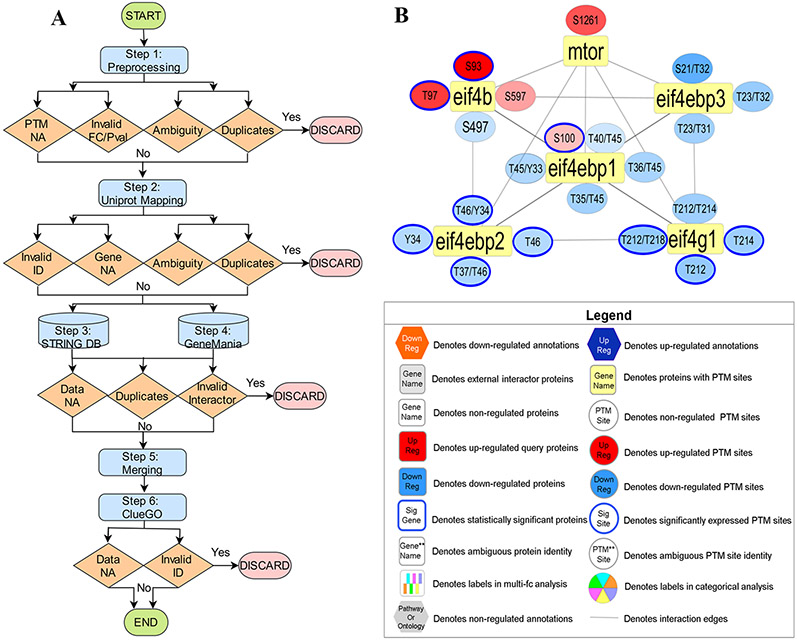
Figure 1.
Overview of PINE Framework. (A) PPIs derived from public databases (e.g., STRING, GeneMANIA) and functional enrichment-based network annotations from ClueGO are processed by the Cytoscape framework to create PPIs networks. By using PINE, protein or PTM associated differential expression (e.g., fold change) or statistical significance data (e.g., p-value) can also be overlaid onto the Cytoscape networks. (B) Example PPIs network depicting both statistically significant and nonsignificant PTM sites. The rectangular yellow nodes denote proteins (represented by their primary genes), connected to circular nodes representing PTM sites. The color refers to either down-regulated (blue) or up-regulated (orange) sites with statistically significant sites outlined blue. The legend describes the various node types and colors used in visualization of PPI networks

