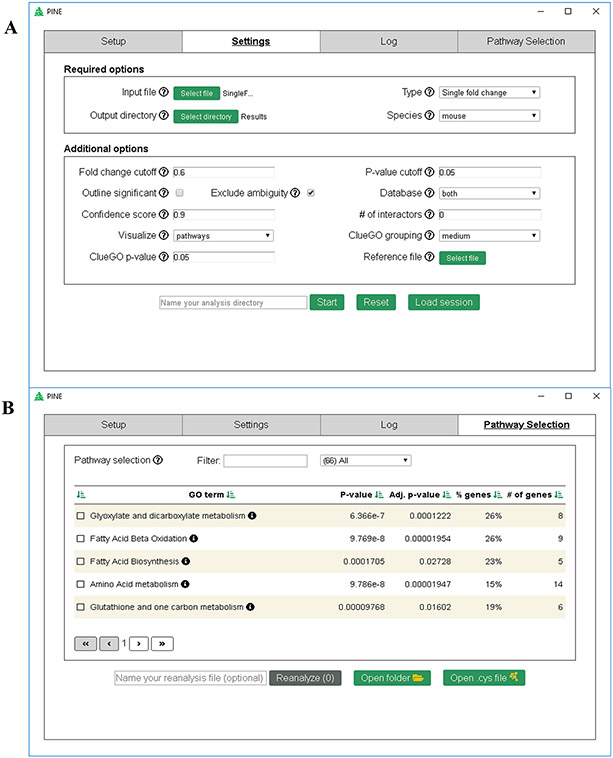
Figure 2.
PINE graphical user interface. (A) Screenshot illustrating the settings tab for easy query upload, providing users the choice to modify parameters for PPIs and annotation analysis. (B) Screenshot illustrating the Pathway Selection tab that lists annotation terms, additionally providing the option to filter, sort, and subsequently select annotation terms of interest in order to generate ontology network.

