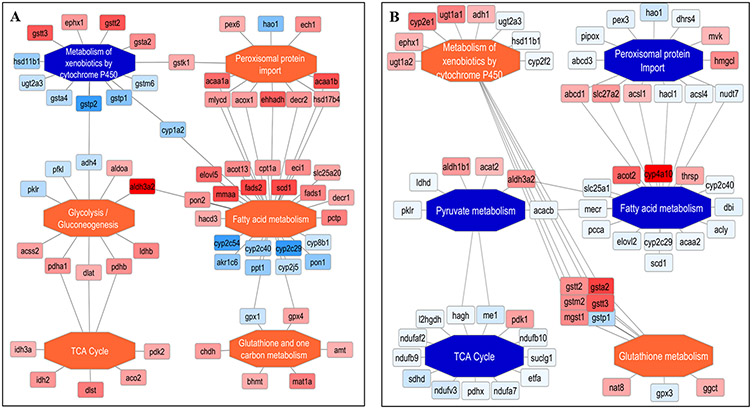
Figure 4.
Enriched functional networks generated by PINE across different NASH models. (A) The Gnmt −/− mice model indicates five activated pathways shown as orange central nodes and the one inhibited pathway shown as blue central nodes along with fold-changes from the different protein nodes. (B) The Mat1a −/− mice model indicates two activated pathways shown as orange central nodes and the four inhibited pathway shown as blue central nodes along with fold-changes from the different protein node.

