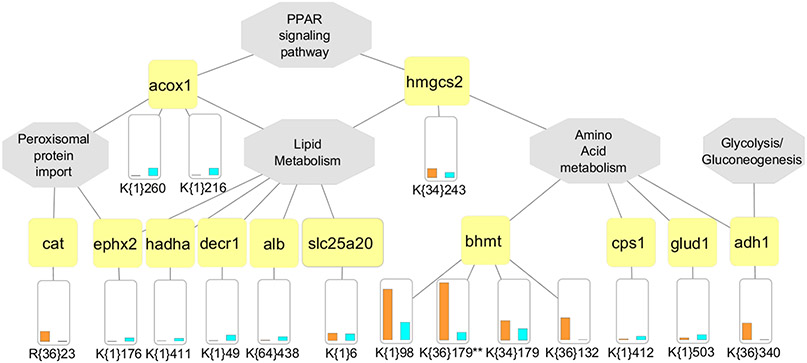
Figure 6.
Multi-PTM network illustrating crosstalk between methylation, acetylation and succinylation. Functionally enriched pathways are shown by central gray nodes along with gene connections shown by yellow nodes. The PTM site level quantitative differences from each mouse model are shown as a bar chart (Gnmt −/− mice indicated by blue bar and Mat1a −/− mice by orange bar). Sites are indicated with unimod accession in curly brackets (Example, K{34}179 and K{36}179 on gene BHMT would indicate lysine monomethylation and lysine dimethylation events on site 179). Ambiguous sites are indicated using double asterisk (**) symbol next to the site. (Example, K{1}110** on gene GLUD1.)

