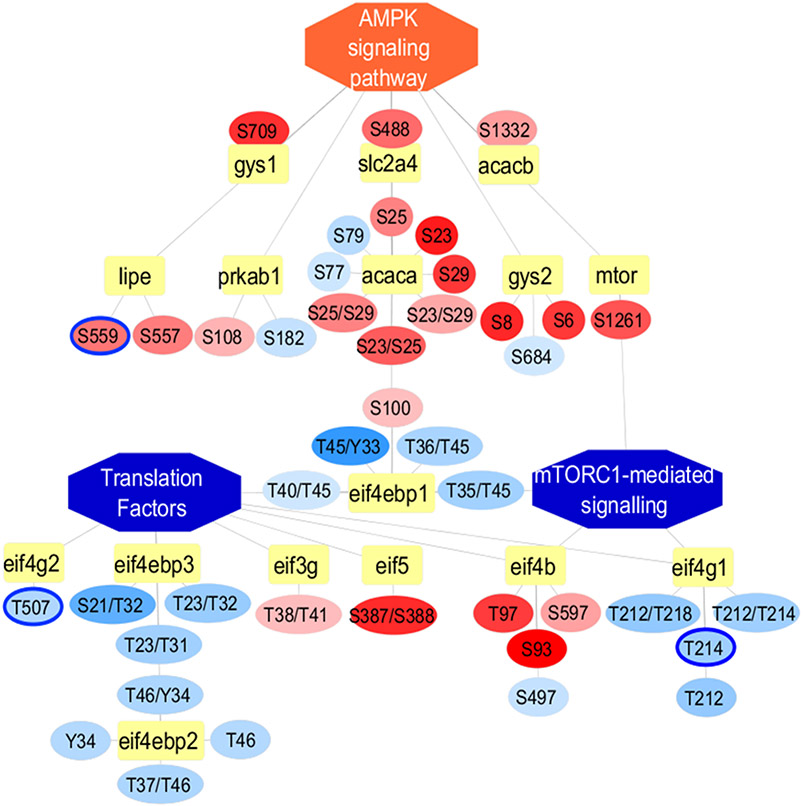
Figure 7.
Phospho-proteome network illustrating significant differentially expressed PTM sites using PINE. Inhibited pathways such as mTORC1-mediated signaling and translation factors are represented as central blue nodes whereas activated pathway such as AMPK signaling pathway are represented as central orange nodes along with gene connections represented as yellow nodes. The PTM site level quantitative differences between Gnmt −/− mice relative to WT littermates are represented as blue for downregulated nodes or orange for upregulated nodes connected to their respective gene nodes. We included both significant and nonsignificant differentially expressed sites indicated by blue node outline and no node outline, respectively.

