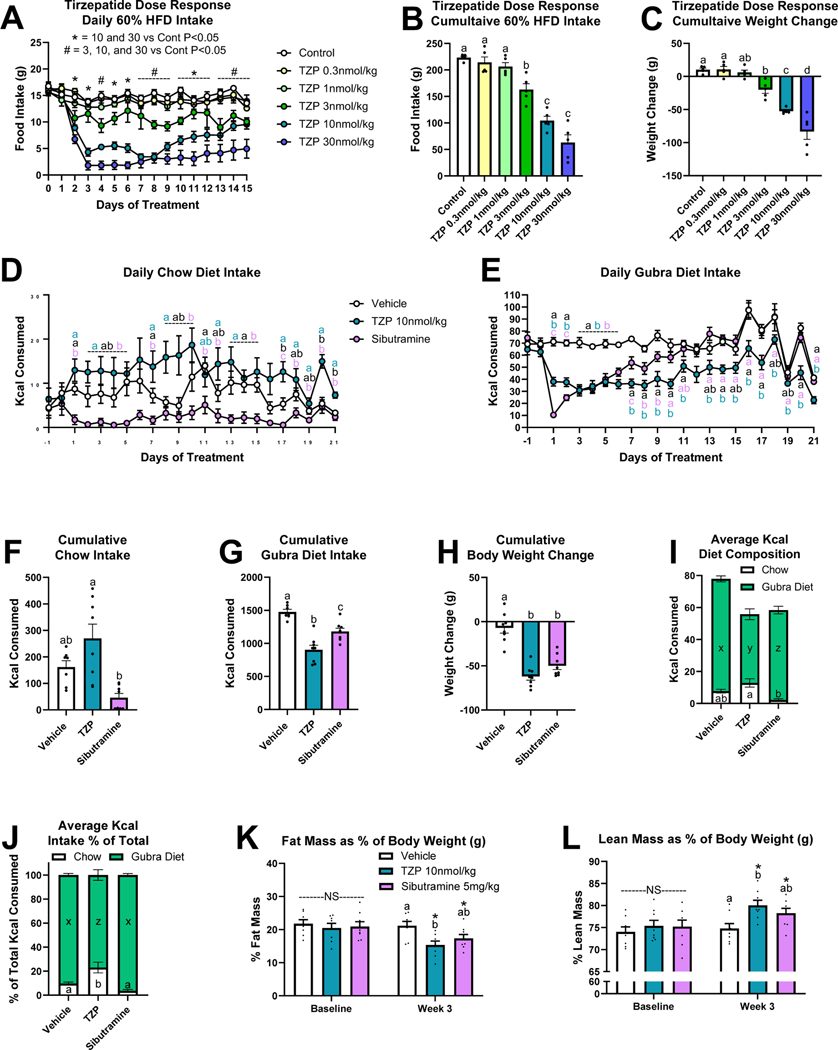
Figure 3. Tirzepatide Dose Response and Two-Choice Preference Intake in Diet-Induced Obese Rats.
Once daily tirzepatide injection dose response [vehicle or 0.3, 1, 3, 10, 30 nmol/kg tirzepatide (TZP)] on daily food intake (A), 15-day cumulative food intake (B), and body weight change (C). N=5 per treatment group. Effect of once daily injections [vehicle, tirzepatide (TZP), or sibutramine] on daily chow (D) and gubra diet (E) intake. 21-day cumulative chow intake (F), gubra diet intake (G), and weight change (H). Daily average intake of chow and gubra diet as Kcals (I) and as a percentage of total Kcal intake (J). Fat mass (K) and lean mass (L) as a percentage of body weight at baseline and week 3 of treatment. Direct comparisons are indicated with letter sets (a,b,c or x,y,z). For panels K-L, comparisons of the same treatment between timepoints are indicated by asterisks. N=8 per treatment group.

