Fig. 1.
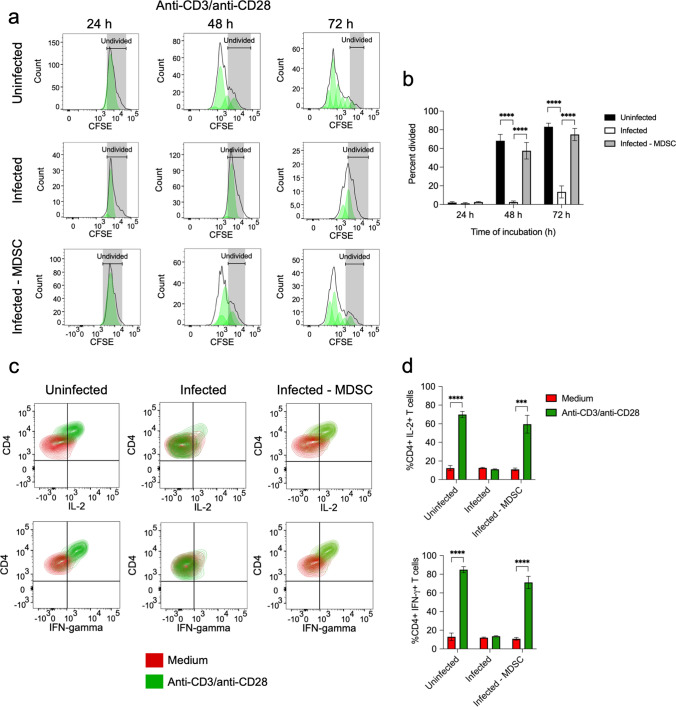
Suppression of CD4+ T cell responses by MDSC. a Flow cytometry histograms showing the kinetic of CD4+ T cells proliferation in spleen cells isolated from either uninfected (upper panels) or S. aureus-infected mice (middle panels) upon stimulation with anti-CD3/anti-CD28 antibodies. Proliferation of stimulated CD4+ T cells in the spleen cell population from S. aureus-infected mice that has been depleted of MDSC prior to stimulation is shown in the lower panels. The gating strategy is described in Supplementary Fig. S1. The percentage of divided CD4+ T cells in each group is shown in b. c Flow cytometry contour plots showing the intracellular staining of IL-2 (upper panels) and IFN-γ (lower panels) in CD4+ T cells within the spleen cell population isolated from uninfected (left panels) or S. aureus-infected (middle panels) mice as well as in MDSC-depleted spleen cells isolated from S. aureus-infected mice (lower panels) cultured for 72 h in the presence (green) or absence (red) of anti-CD3/anti-CD28 antibodies. The frequencies of CD4+ T cells expressing IL-2 (upper panel) or IFN-γ (lower panel) are shown in d. Each bar shows the mean ± SD of three independent experiments. ***p < 0.001, ****p < 0.0001

