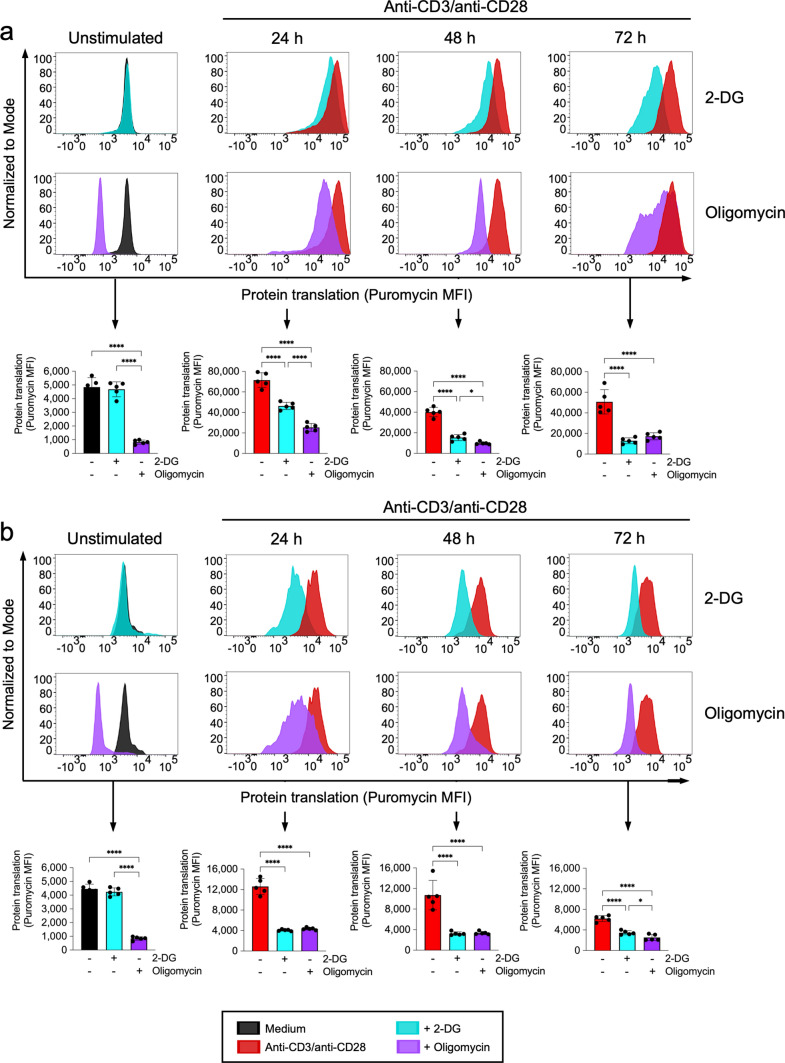
Fig. 4.
Metabolic profile of spleen CD4+ T cells from either uninfected or S. aureus-infected mice upon stimulation with anti-CD3/anti-CD28 antibodies. Flow cytometry histograms showing the levels of protein translation (puromycin MFI) in CD4+ T cells in spleen cells from uninfected (a) or S. aureus-infected (b) mice at the indicated times of stimulation with anti-CD3/anti-CD28 antibodies and treated with either the glycolysis inhibitor 2-DG (upper histograms) or the oxidative phosphorylation inhibitor oligomycin (lower histograms). Quantification of protein translation levels (puromycin MFI) in the different conditions is shown in the lower panels in a and b. *p < 0.05, ****p < 0.0001

