Fig. 6.
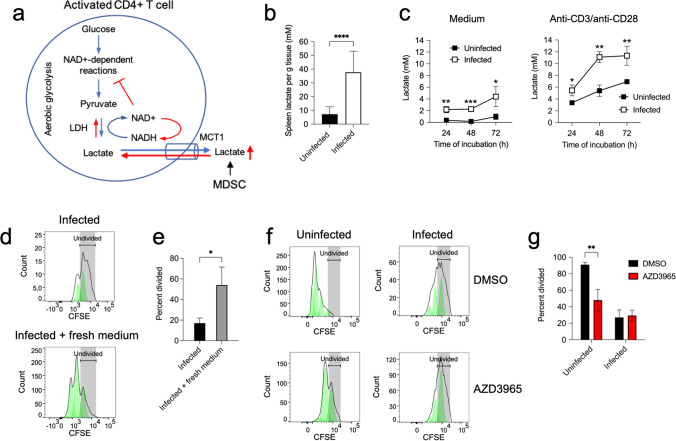
Lactate levels in spleen tissue and in the supernatant of cultured spleen cells from uninfected or S. aureus-infected mice a Scheme showing the potential role of lactate in the suppression of CD4+ T cell responses by MDSC in the spleen of S. aureus-infected mice. LDH (lactate dehydrogenase), NAD+ (oxidized nicotinamide adenine dinucleotide), NADH (reduced nicotinamide adenine dinucleotide), MCT1 (monocarboxylate transporter 1), MDSC (myeloid-derived suppressor cells). b Lactate concentration in spleen tissue of uninfected (black bar) or S. aureus-infected (white bar) mice. c Lactate concentration in the supernatant of spleen cells isolated from either uninfected (black symbols) or S. aureus-infected (white symbols) mice at progressing times of incubation in either medium alone (left panel) or with anti-CD3/anti-CD28 antibodies (right panel). d Flow cytometry histograms showing proliferation of CD4+ T cells in spleen cells isolated from S. aureus-infected mice at 72 h upon stimulation with anti-CD3/anti-CD28 antibodies without changing (upper panel) or after changing the medium every 24 h (lower panel). The percentage of divided CD4+ T cells in each group is shown in e. f Flow cytometry histograms showing proliferation of CD4+ T cell in spleen cells isolated either from uninfected (left histograms) or from S. aureus-infected (right histograms) mice at 72 h upon stimulation with anti-CD3/anti-CD28 antibodies in the presence of either the MCT1 inhibitor AZD3965 (100 nM) (lower histograms) or vehicle control DMSO (upper histograms). The percentage of divided CD4+ T cells in each group is shown in g. Each bar shows the mean ± SD of five independent experiments. *p < 0.05, **p < 0.005, ***p < 0.001, ****p < 0.0001

