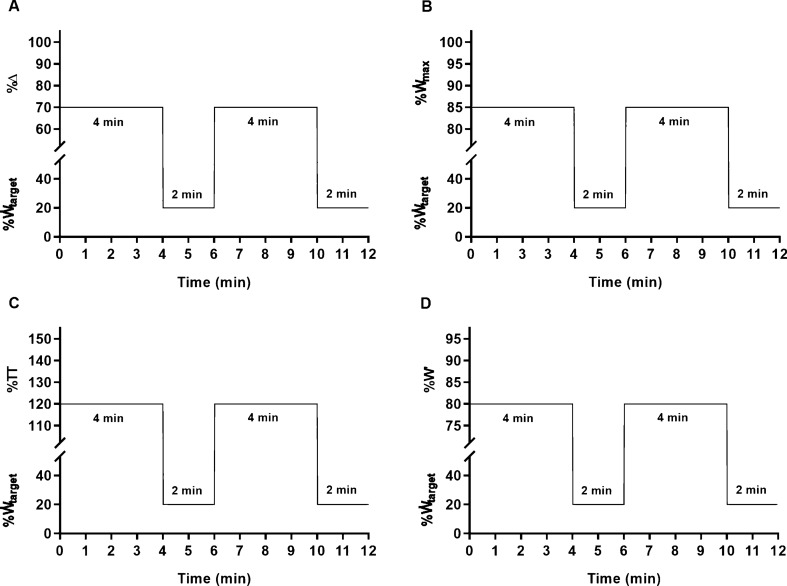
Fig. 2.
Schematic representation of the high-intensity interval training sessions that participants performed to exhaustion at 70%Δ (panel A), 85%max (panel B), 120%TT (panel C), and 80%W' (panel D), randomly, on four separate occasions. See text for intensity prescription abbreviations. target represents the work rate prescribed for each condition. An identical 10 min warm-up, followed by a two-minute resting period, preceded all sessions. For clarity, these are omitted and only two work intervals are represented

