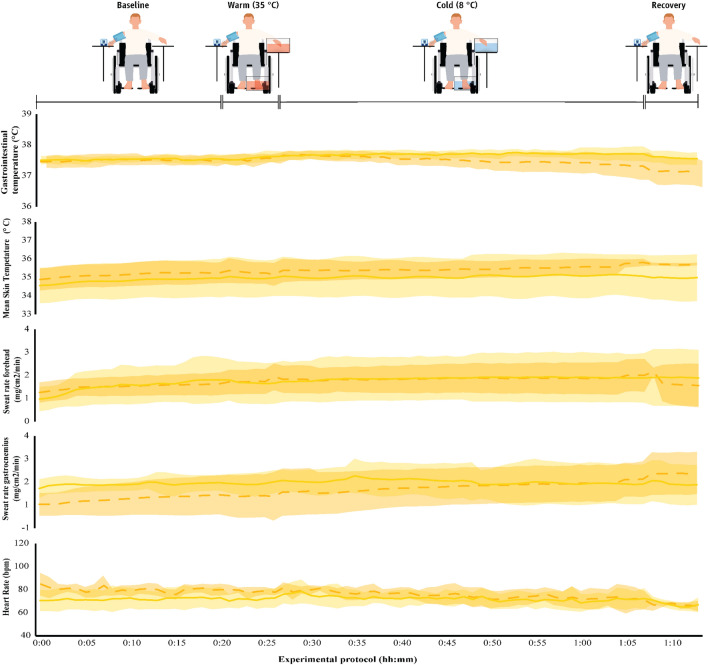
Fig. 9.
Physiological parameters (mean ± SD) during exposure to the hot environment (34 ± 1 °C) in the two groups. The first 20 min (00:00–00:20) indicate data collected during the baseline phase, the next five min (00:20–00:25) indicate responses during the warm immersion, the next 40 min (00:30–00:70) indicate responses during the cold immersion, and the final five min (00:70–00:75) show responses during the recovery phase. Continuous yellow lines indicate results for paraplegic participants and with dashed yellow lines present results for the able-bodied individuals

