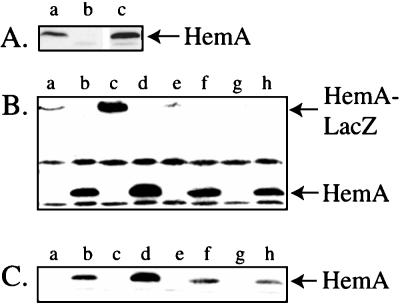
FIG. 4.
Western blot (immunoblot) analysis of HemA[WT] and HemA[KK] expressed from F′ plasmids in S. typhimurium. (A) Comparison of HemA levels expressed from single-copy hemA and F′ plasmid-borne hemA[WT]. Cultures were grown to an OD600 of 0.4 in minimal MOPS-glycerol medium with 2 μM ALA (and kanamycin when necessary to maintain an F′ plasmid). Genotypes are abbreviated here and in subsequent figures; full genotypes are given in Table 1. The arrow indicates the native HemA protein. Lanes: a, LT-2 wild type; b, TE518 hemA60 recA; c, TE7620 hemA60 recA/F′ hemA[WT]. (B) Comparison of HemA and HemA-LacZ levels in the mutants and wild type. Cultures were grown to an OD600 of 0.4 in minimal MOPS-glycerol medium with 2 μM ALA (and kanamycin when necessary to maintain F′ plasmids). Samples were processed as described above for immunoblotting with anti-HemA MAb H17. Similar results were also observed with MAb H23. The positions of native HemA and HemA1–416-LacZ are indicated. Lanes: a, TE7619 hemA60 recA/F′ hemA1–416[WT]-lac [pr]; b, TE7620 hemA60 recA/F′ hemA[WT]; c, TE7621 hemA60 recA/F′ hemA1–416[KK]-lac [pr]; d, TE7622 hemA60 recA/F′ hemA[KK]; e, TE7691 hemA60 recA/F′ hemA1–416[AA]-lac [pr]; f, TE7693 hemA60 recA/F′ hemA[AA]; g, TE7695 hemA60 recA/F′ hemA1–416 [N-myc]-lac [pr]; h, TE7696 hemA60 recA/F′ hemA[N-myc]. (C) This panel shows a lighter exposure of the gel shown in panel B, which allows better visualization of the increase in HemA[KK] protein in lane d.

