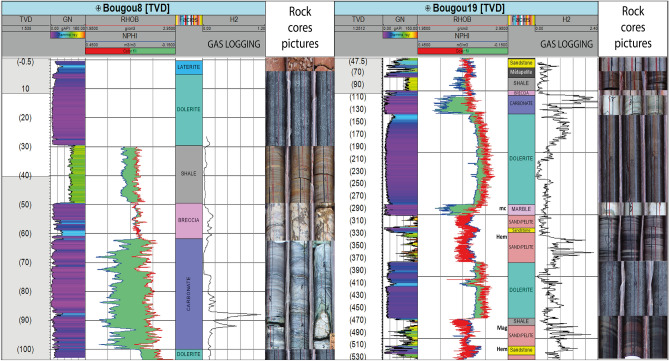
Figure 4.
The different data used to identify and characterize the different formations and hydrogen accumulation zones between 0 and 530 m. Track 1: The true vertical depth, Track 2: The natural gamma-ray (GN), Track 3: The density (RHOB) and neutron porosity (NPHI) in limestone matrix scale, Track 4: The formation’s nature, Track 5: concentration of H2 from gas logging and Track 6: cores images. mc zone of intense contact metamorphism, Mag presence of magnetite, Hem presence of hematite.

