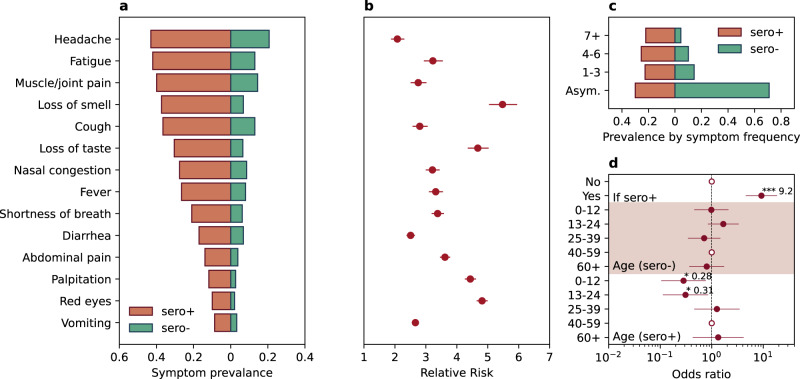
Fig. 3. COVID-19 related symptom presentations among both seropositive and seronegative individuals.
a Prevalence of symptoms among both seropositive (red bar) and seronegative individuals (green bar). b The relative risk of symptom presentation in seropositive vs seronegative individuals. Panel b share the same y axis as panel a. Dots and horizontal lines represent point estimate and 95% confidence interval, based on the symptom presentations of 719 household contacts. c The prevalence of symptoms by symptom frequency (Asym. denotes asymptomatic individuals, 1–3 denotes individuals having 1–3 of all symptoms listed in a, 4–6 denotes having 4–6 of all symptoms listed in a and 7+ denotes having more than 7 symptoms listed in a. d Regression analysis on the risk of being symptomatic (having a least 1 symptom in a by serologic status and age. “If sero + ” denotes if the individual is seropositive; “Age (sero-)” denotes the age dependency of being symptomatic among seronegative individuals; Age (sero + ) denotes the age dependency of being symptomatic among seropositive individuals. Dots and horizontal lines represent point estimate and 95% confidence interval, based on the symptom presentations of 719 household contacts.

