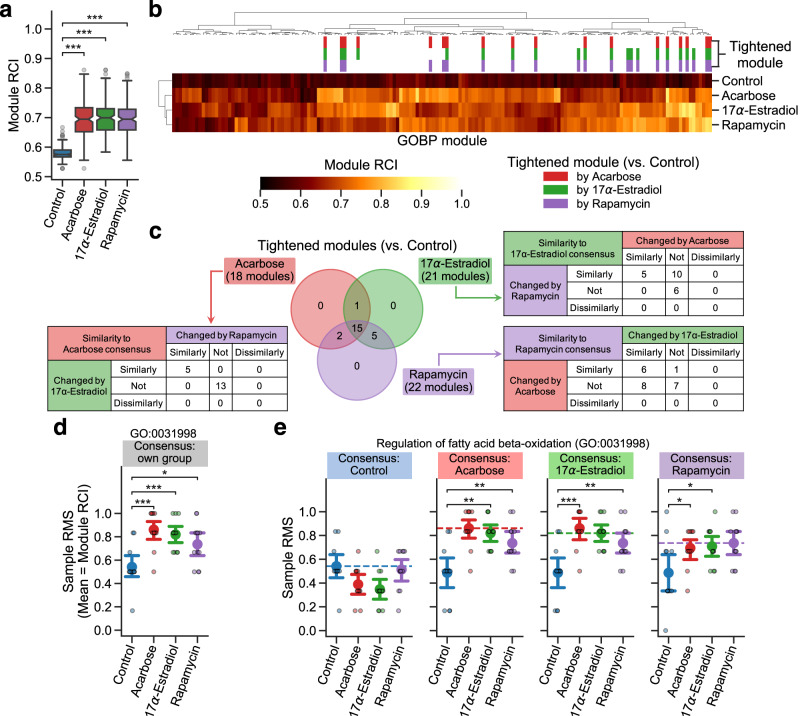
Fig. 2. Lifespan-extending interventions increased proteomic profile conservation in a priori modules.
a–e Differential Rank Conservation (DIRAC) analysis of the LC-M001 proteomics data using Gene Ontology Biological Process (GOBP)-defined modules (see Supplementary Data 1 for complete results). a, b Overall distribution of module rank conservation index (RCI). Data in a: median (center line), 95% confidence interval (CI) around median (notch), [Q1, Q3] (box limits), [xmin, xmax] (whiskers), where Q1 and Q3 are the 1st and 3rd quartile values, and xmin and xmax are the minimum and maximum values in [Q1 − 1.5 × IQR, Q3 + 1.5 × IQR] (IQR: the interquartile range, Q3 − Q1), respectively; n = 164 modules. ***P < 0.001 by two-sided Mann–Whitney U-tests after the Benjamini–Hochberg adjustment across three comparisons. The top color columns in b highlight the modules that exhibited (1) the significant intervention effect on module RCI (Analysis of Variance (ANOVA) after the Benjamini–Hochberg adjustment across 164 modules) and (2) significantly higher RCI in intervention group than control group (i.e., tightened module; the post hoc two-sided Welch’s t-tests after the Benjamini–Hochberg adjustment across three comparisons). c Venn diagram of the significantly tightened modules by each intervention. For each set of the tightened modules, contingency table indicates the number of modules for which the other intervention groups exhibited significantly higher or lower mean of rank matching scores (RMSs) under the rank consensus than control group (i.e., similarly or dissimilarly changed module to the consensus group, respectively; two-sided Welch’s t-tests after the Benjamini–Hochberg adjustment across six (two comparisons × three rank consensus) comparisons). d, e Sample RMS distributions for an example of the tightened modules (GO:0031998, regulation of fatty acid β-oxidation). Dashed line in e indicates the mean of RMSs for the rank consensus group (i.e., RCI). Data: the mean (dot) with 95% CI (bar); n = 12 mice. *P < 0.05, **P < 0.01, ***P < 0.001 by two-sided Welch’s t-tests after the Benjamini–Hochberg adjustment across three (d) or six (two comparisons × three rank consensus; e) comparisons.

