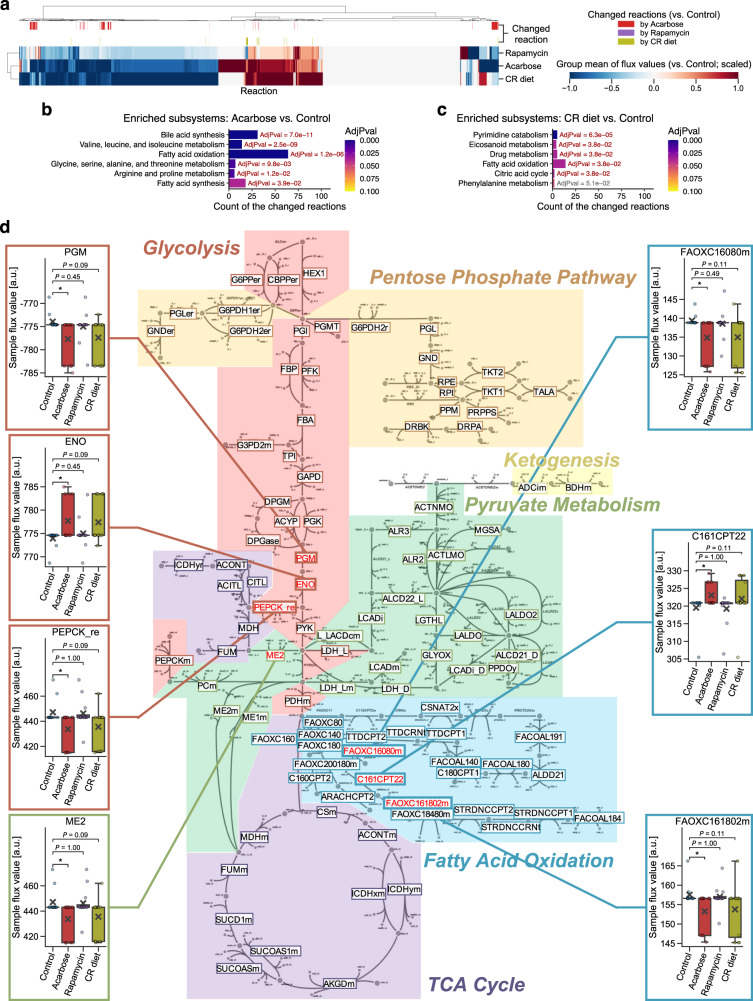
Fig. 6. Lifespan-extending interventions shifted reaction fluxes in fatty acid metabolism.
a–d Integrated analysis of the M001-related transcriptomics data with mouse genome-scale metabolic model (GEM; see Supplementary Data 8 for complete results). CR: calorie restriction. a Change in the group mean of flux values for each reaction. The presented group mean value was centered and scaled per reaction (see Methods); i.e., its positive value corresponds to an increase in the mean of flux values compared to the corresponding control group, and vice versa. The top color columns highlight the reactions that exhibited difference in flux value distribution between control and intervention (i.e., potentially changed reaction; nominal P < 0.05 by two-sided Mann–Whitney U-test). n = 3736 reactions. b, c Shifted GEM subsystems by acarbose (b) or CR diet (c). Significance was assessed as the enrichment of GEM subsystem in the potentially changed reactions, using overrepresentation tests with the Benjamini–Hochberg adjustment across 21 (b) or 11 (c) subsystems. Only the subsystems that exhibited nominal P < 0.05 are presented. AdjPval: adjusted P-value from the overrepresentation test. d Changed reactions within the central energy metabolism. The 102 highlighted reaction IDs are the reactions assessed in this study. Flux value distributions are presented only for the potentially changed reactions within this diagram. Data: mean (cross sign), median (center line), [Q1, Q3] (box limits), [xmin, xmax] (whiskers), where Q1 and Q3 are the 1st and 3rd quartile values, and xmin and xmax are the minimum and maximum values in [Q1 − 1.5 × IQR, Q3 + 1.5 × IQR] (IQR: the interquartile range, Q3 − Q1), respectively; n = 12 mice. *P < 0.05 by two-sided Mann–Whitney U-test after the Benjamini–Hochberg adjustment across three comparisons.

