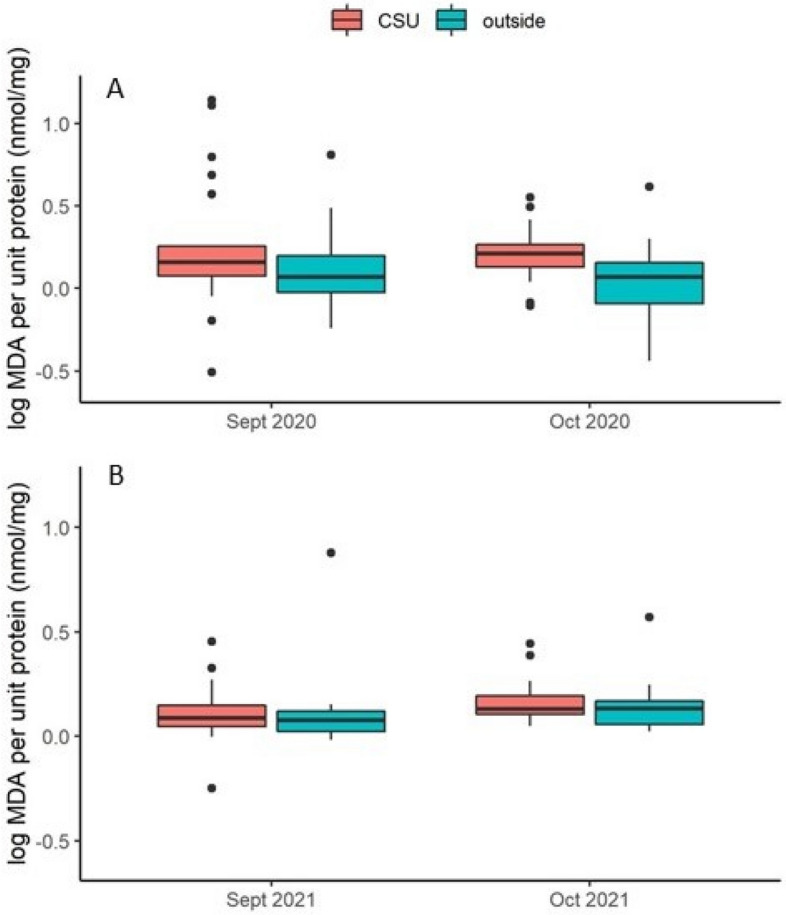
Figure 8.

Log MDA per unit protein (nmol/mg) before and after cold storage. (A) 2020–21 experiment; (B) 2021–22 experiment. Boxes are defined as 1.58 × IQR/n0.5, where IQR is the inter-quartile range and n is the number of data. Points represent data considered outliers within the respective treatment group. “CSU” indicates colonies that were placed in the cold storage unit and “outside” indicates colonies that remained outdoors. Small significant differences were observed between the treatment groups “CSU” and “outside.”
