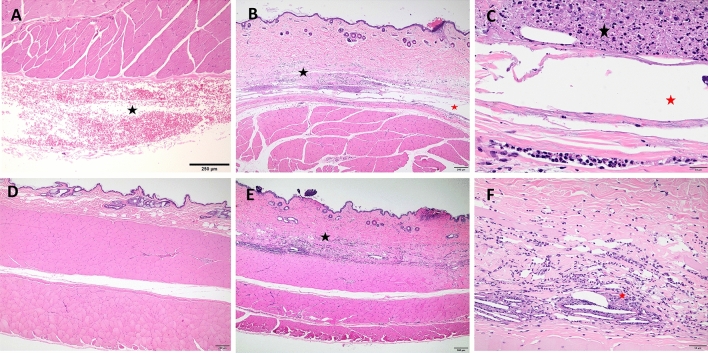
Figure 5.
Representative H&E histology images of skin sections. Saline control site at acute time point (A) depicts acute hemorrhage (star) underneath deep musculature at the subcutaneous injection site (4 × magnification). BSR site at acute time point under 4 × magnification (B) depicts skin and underlying musculature with disruption of deep dermis (black star) and hypodermis by necrosis and inflammation (black arrows) with clear distended spaces comprising of injected material (red star). Focal epithelial thickening and hyperkeratosis is present at needle entry (injection) site (red arrow). BSR site at acute time point under 20 × magnification (C) depicts clear space associated with injected material (red star) surrounded by necrotic debris (black star) and degenerate neutrophils (black arrow). Saline control site at chronic time point (D) demonstrates normal skin and underlying abdominal musculature. EXR site at acute time point under 4 × magnification (E) of skin and underlying musculature shows disruption of deep dermis (black star) and hypodermis due to necrosis and inflammation (black arrows), with embedded clear needle-like crystals of injected material (yellow arrows). Focal epithelial erosion and necrosis is present at the injection site (red arrow). 20 × magnification of EXR site at acute time point (F) shows clear acicular crystals associated with injected material (black arrows) surrounded by degenerate neutrophils and necrotic debris (red star).

