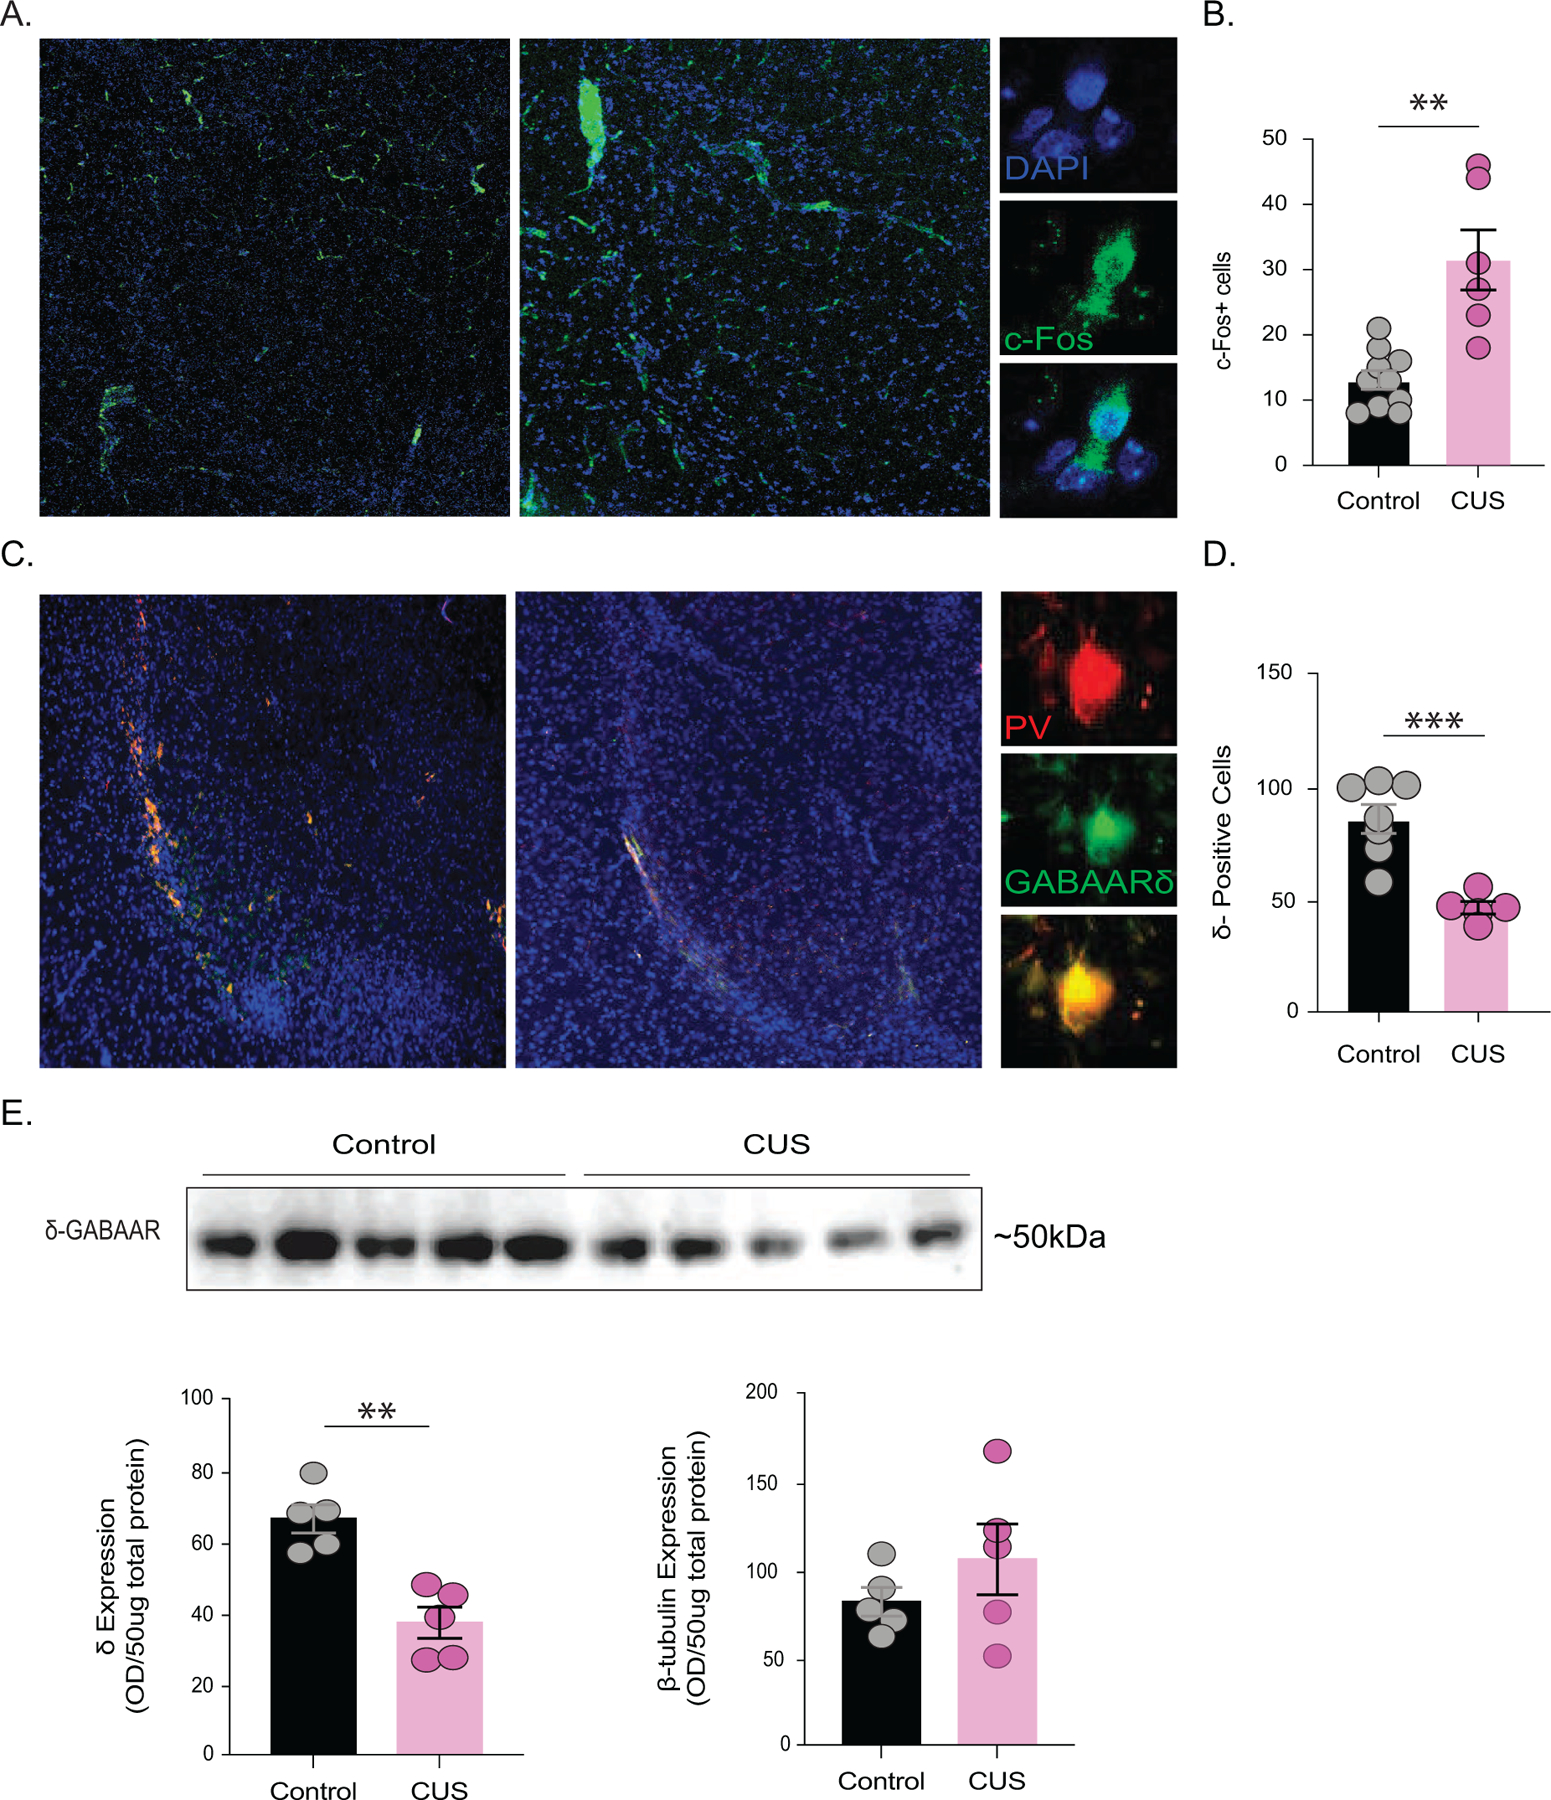
Figure 2. δ-GABAARs are downregulated in the BLA following CUS.

(A) Representative images of cFos immunofluorescence in the BLA of control and CUS mice. The average number of cFos positive cells in the BLA is reduced in mice subjected to CUS compared to controls (B) control n=10 mice, CUS n=6 mice, average 5 sections per mouse. (C) Representative images of immunofluorescence co-labelling of parvalbumin (PV) interneurons and δ-GABAARs in the BLA. The average number of δ-positive cells in the BLA from control and CUS mice (D) control n=7 mice, CUS n=5 mice, average 5 sections per mouse. (E) (above) Representative western blot for δ-GABAAR expression in total protein isolated from the BLA from control and CUS mice. (below) The average optical density expression of δ-GABAARs and β-tubulin per 25ug of total protein. control n=5 mice, CUS n=5 mice. **denotes p<0.01, ***p<0.001 using an unpaired t-test.
