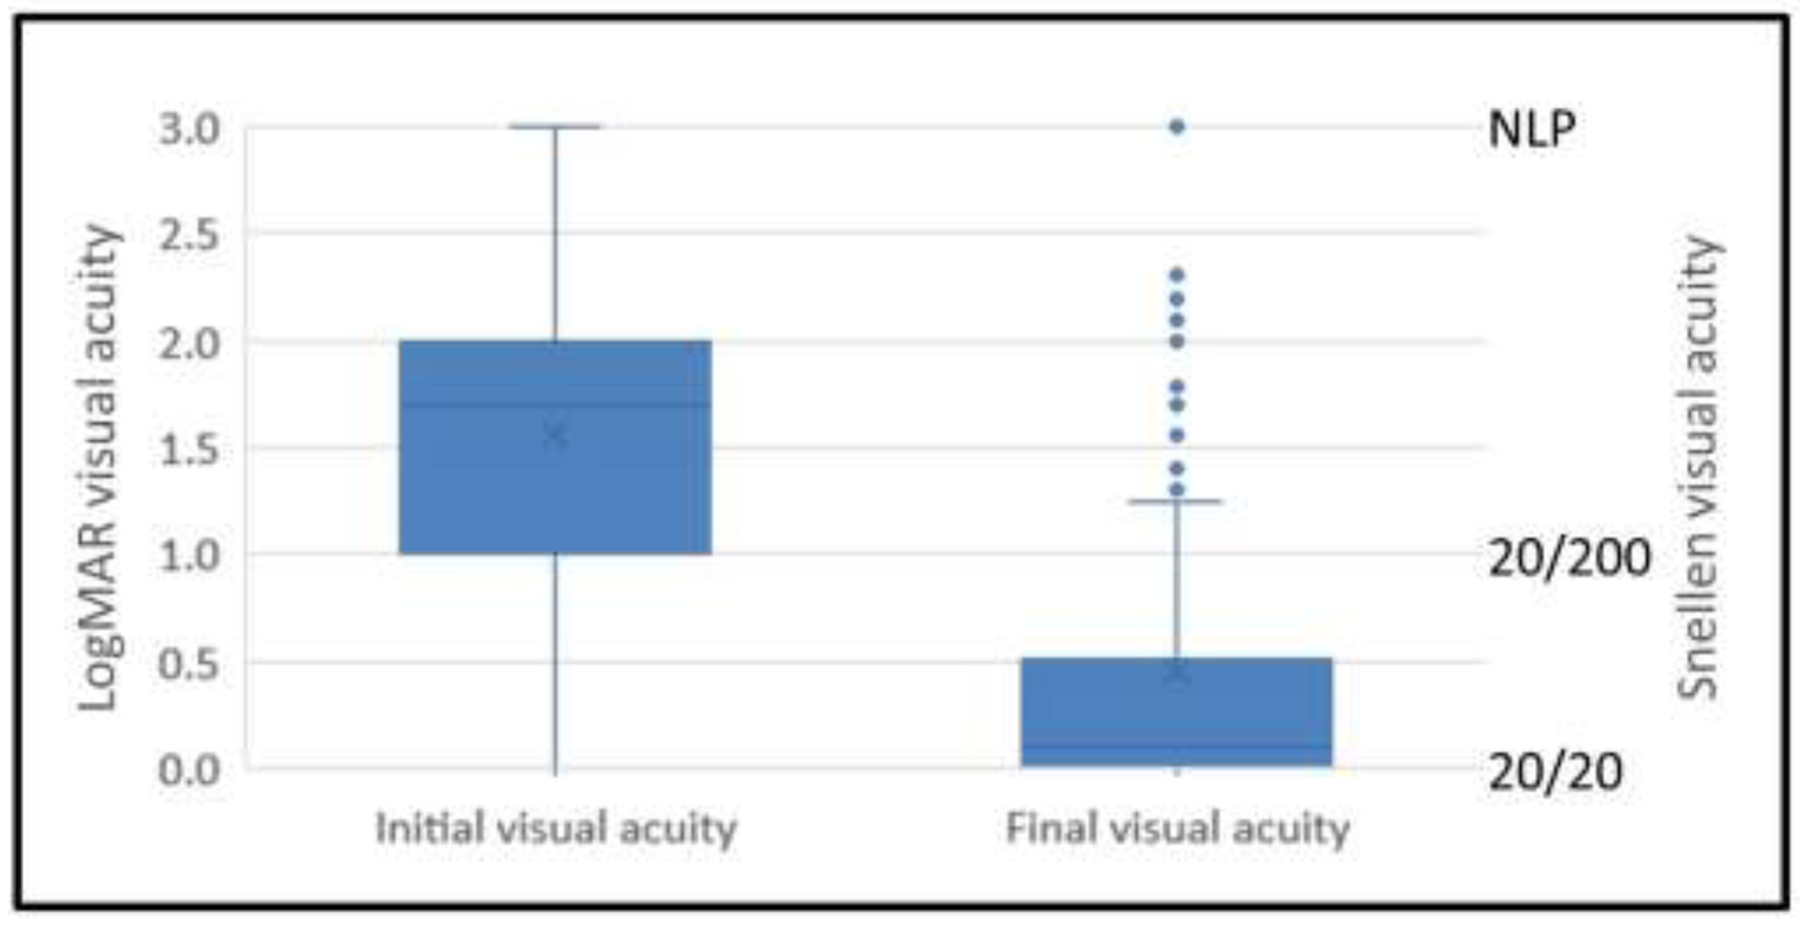
Figure 2: Visual acuity at time of plasma exchange and final visual outcome.

Box and whisker plots showing the median visual acuity at the time of plasma exchange and the final visual acuity after plasma exchange. The box represents the 25–75% interquartile intervals and the whiskers cover the minimum and maximum range.
