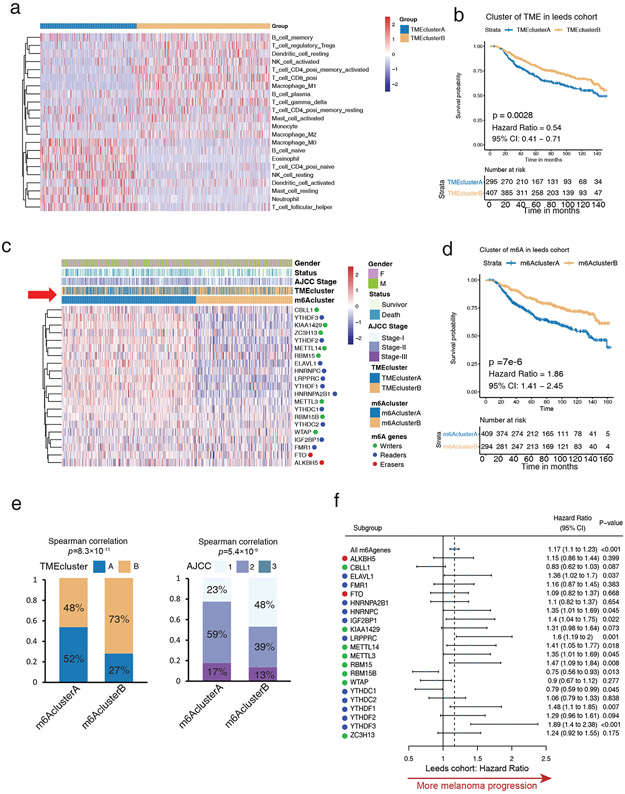
Figure 1: High m6A modifications correlate to inactive immune microenvironments in the training cohort (LMC).
(a) Heatmap of unsupervised clustering based on 22 TME immune cells of 703 patients in the Leeds Melanoma Cohort (LMC) showing two distinct immune cell infiltration patterns: TMEclusterA (blue) and TMEclusterB (yellow). The rows of the heatmap show the value of immune cells (z-score) calculated by CIBERSORT. Naive B cells, neutrophils, and other resting type immune cells are highly expressed in TMEclusterA, while T cells, mature B cells, and other activated type immune cells are highly expressed in TMEclusterB. (b) Survival analyses based on TMEclusterA and B of 703 patients in LMC show that TMEclusterB has a significant survival advantage (HR, 0.54; 95% CI, 0.41–0.71; p = 0.0028). (c) Heatmap of unsupervised clustering based on 21 m6A regulators of 703 patients in LMC show two distinct m6A modification patterns, namely m6AclusterA (blue) and m6AclusterB (yellow). The overall expression of m6A regulators is higher in m6AclusterA and lower in m6AclusterB. The gender, survival status, AJCC stage, TMEcluster, and m6Acluster are presented as annotations. From the row of annotation (red arrow), most of TMEclusterA gathered with m6AclusterA and most of TMEclusterB gathered with m6AclusterB, reflecting the positive relationship with TME and m6A patterns. m6AclusterB was positively associated with favorable survival status and earlier AJCC stage. (d) Survival analyses based on m6AclusterA and B of 703 patients in Leeds melanoma cohorts show that m6AclusterB has a significant survival advantage (HR, 1.86; 95% CI, 1.41–2.45; p = 7X10⁻⁶). (e) The patients in m6AclusterB were associated with significantly higher proportion of TMEclusterB and earlier AJCC stage in the Leeds melanoma cohort. (f) Forest plot estimating the clinical prognostic value of each m6A regulator. The horizontal lines represent the hazard ratio (95% CI) of each m6A regulator. The dotted vertical line represents all m6A regulators’ hazard ratio which is >1, indicating an m6A signature is an unfavorable prognostic biomarker.

