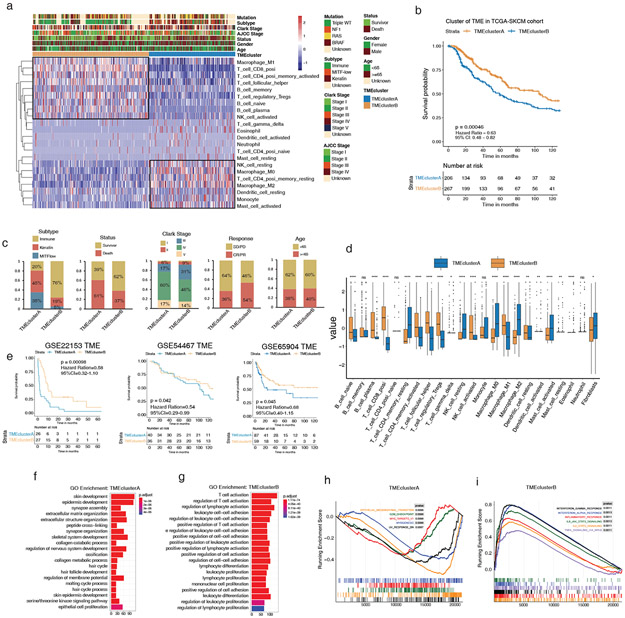
Figure 3: The landscape and clinicopathological characteristics of TME in melanoma validation cohorts.
(a) Heatmap of unsupervised clustering based on 22 TME immune cells of 473 patients in TCGA-SKCM, showing two immune cell infiltration patterns: TMEclusterA (blue) and TMEclusterB (yellow). The rows of the heatmap show the value of immune cells (z-score) calculated by CIBERSORT. Macrophage, neutrophil, and other resting type immune cells are highly expressed in TMEclusterA while T cells and B cells are highly expressed in TMEclusterB. The mutation, subtype, Clark stage, AJCC stage, survival status, gender, age, and TMEcluster are presented as annotations. (b) Survival analyses based on TMEclusterA and B of 473 patients in TCGA cohorts show that TMEclusterB has a significant survival advantage (HR, 0.54; 95% CI, 0.41–0.71; p = 0.0028). (c) The clinicopathological parameters in TME clusterB were associated with better therapy response, more immune subtype, better survival status, and earlier Clark stage. Age is allocated evenly. CR/PR: complete response and partial response; SD/PD: stable and progressive disease. (d) The fraction of immune cells in TMEclusterA and B in TCGA-SKCM. The upper and lower ends of the vertical line represent the maximum and minimum values. The three horizontal lines of the boxplot represent the first quartile, median, and third quartile. Outliers are expressed in scattered dots. The Kruskal–Wallis test was used to calculate the statistical difference (*p < 0.05, **p < 0.01, ***p < 0.001, ****p < 0.0001). “NS” indicates no significant difference. (e) Survival analyses based on TMEclusterA and B in GSE22153 (HR, 0.58; 95% CI, 0.32–1.10; p = 0.00098), in GSE54467 (HR, 0.54; 95% CI, 0.29–0.99; p = 0.042), and in GSE65904 (HR, 0.68; 95% CI, 0.40–1.15; p = 0.045), indicating that TMEclusterB has a significant survival advantage. (f–g) Gene ontology (GO) analysis of differentially expressed genes (DEG) presented higher immune cell activation in TMEclusterB (g) and higher skin and skin appendage development in TMEclusterA (f) in TCGA-SKCM. (h–i), GSEA enrichment analysis of DEG presented higher EMT, myogenesis, and UV response in TMEclusterA (h), and higher IFNG, IFNA response, inflammatory, and TNFA signaling in TMEclusterB (i).

