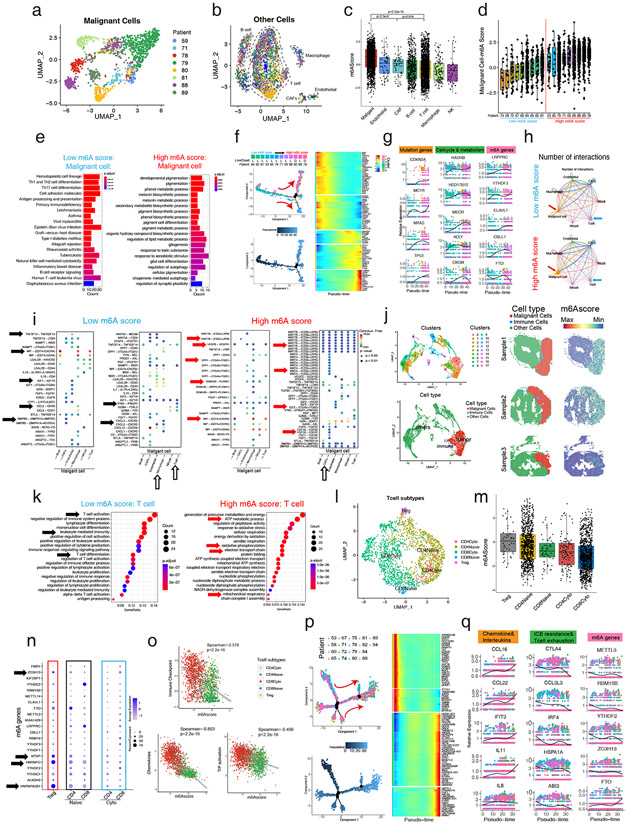
Figure 5: Single-cell and spatial RNA-seq reveals high m6A modification promotes malignant progression and reduces immune infiltration in melanoma.
(a) UMAP plot of 500 m6A relative gene expression profiles of malignant cells in melanoma patients. Malignant cells from different patients gather together. Different patients with malignant cells are shown in different colors. (b) UMAP plot of 500 m6A relative gene expression profiles of other cells of melanoma patients. Different types of cells gather together. Different patients with malignant cells are shown in different colors. (c) The m6Ascores of malignant cells are significantly higher than other cells, especially immune cells. (d) The m6Ascores of different patients. Melanoma patients were divided into high m6Ascore and low m6Ascore groups equally. (e) KEGG enrichment analysis of the DEGs illustrates antigen presentation, T helper cells, NK cells, and B cell signaling highly expressing in malignant cells of low m6Ascore patients, while pigmentation signals, melanosome metabolic signals, and energy metabolism signals highly expressing in malignant cells of high m6Ascore patients. (f) Pseudotime analysis showed that the malignant cell development pattern follows the patient’s m6Ascore ranking and patient mortality trends. (g) Melanoma mutation, cell cycle, metabolism, and m6A readers (LRPPRC, YTHDF3, ELAVL1) and writers (CBLL1) of malignant cells increase while m6A eraser (FTO) decreased with pseudotime. (h) The T cell and malignant cell interaction is greater, while CAFs and malignant cell interaction is lower in the low m6Ascore patients than in the high m6Ascore patients. The thicker line indicates a greater number of interactions. (i) The ligand-receptor pairs of different cells that originate from malignant cells (left) or act on malignant cells (right) of low m6Ascore patients or high m6Ascore patients (j) UMAP shows the clustering and cell classification of each locus of the spatial transcriptome (left), and the m6Ascore in the malignant cells are significantly higher than in the immune cells and other cells (right). (k) KEGG enrichment analysis of the DEGs illustrates T cell activation, immune cell activation, and T cell differentiation pathways highly expressed in T cells of low m6Ascore patients, and energy metabolism signals highly expressing in T cells of high m6Ascore patients. (l) UMAP plot of 500 m6A relative gene expression profiles of T cells of melanoma patients. Different types of T cells gather together and are shown in different colors. (m) Tregs have the highest m6Ascore, while cytotoxic T cells’ m6Ascores are significantly lower. (n) The expression of individual m6A genes in different T cell subtypes. (o) Spearman correlation analysis shows that the m6Ascore is negatively correlated with immune checkpoint, chemokines, and TIP activation in T cells. (p) Pseudotime analysis showed the T cell development pattern. (q) Chemokines and interleukins increase while ICB resistance, T cell exhaustion and m6A readers (YTHDF2, RBM15B) and writers (METTL3, ZC3H13) of T cells decreased but m6A eraser (FTO) increased with pseudotime.

