
Figure 2.
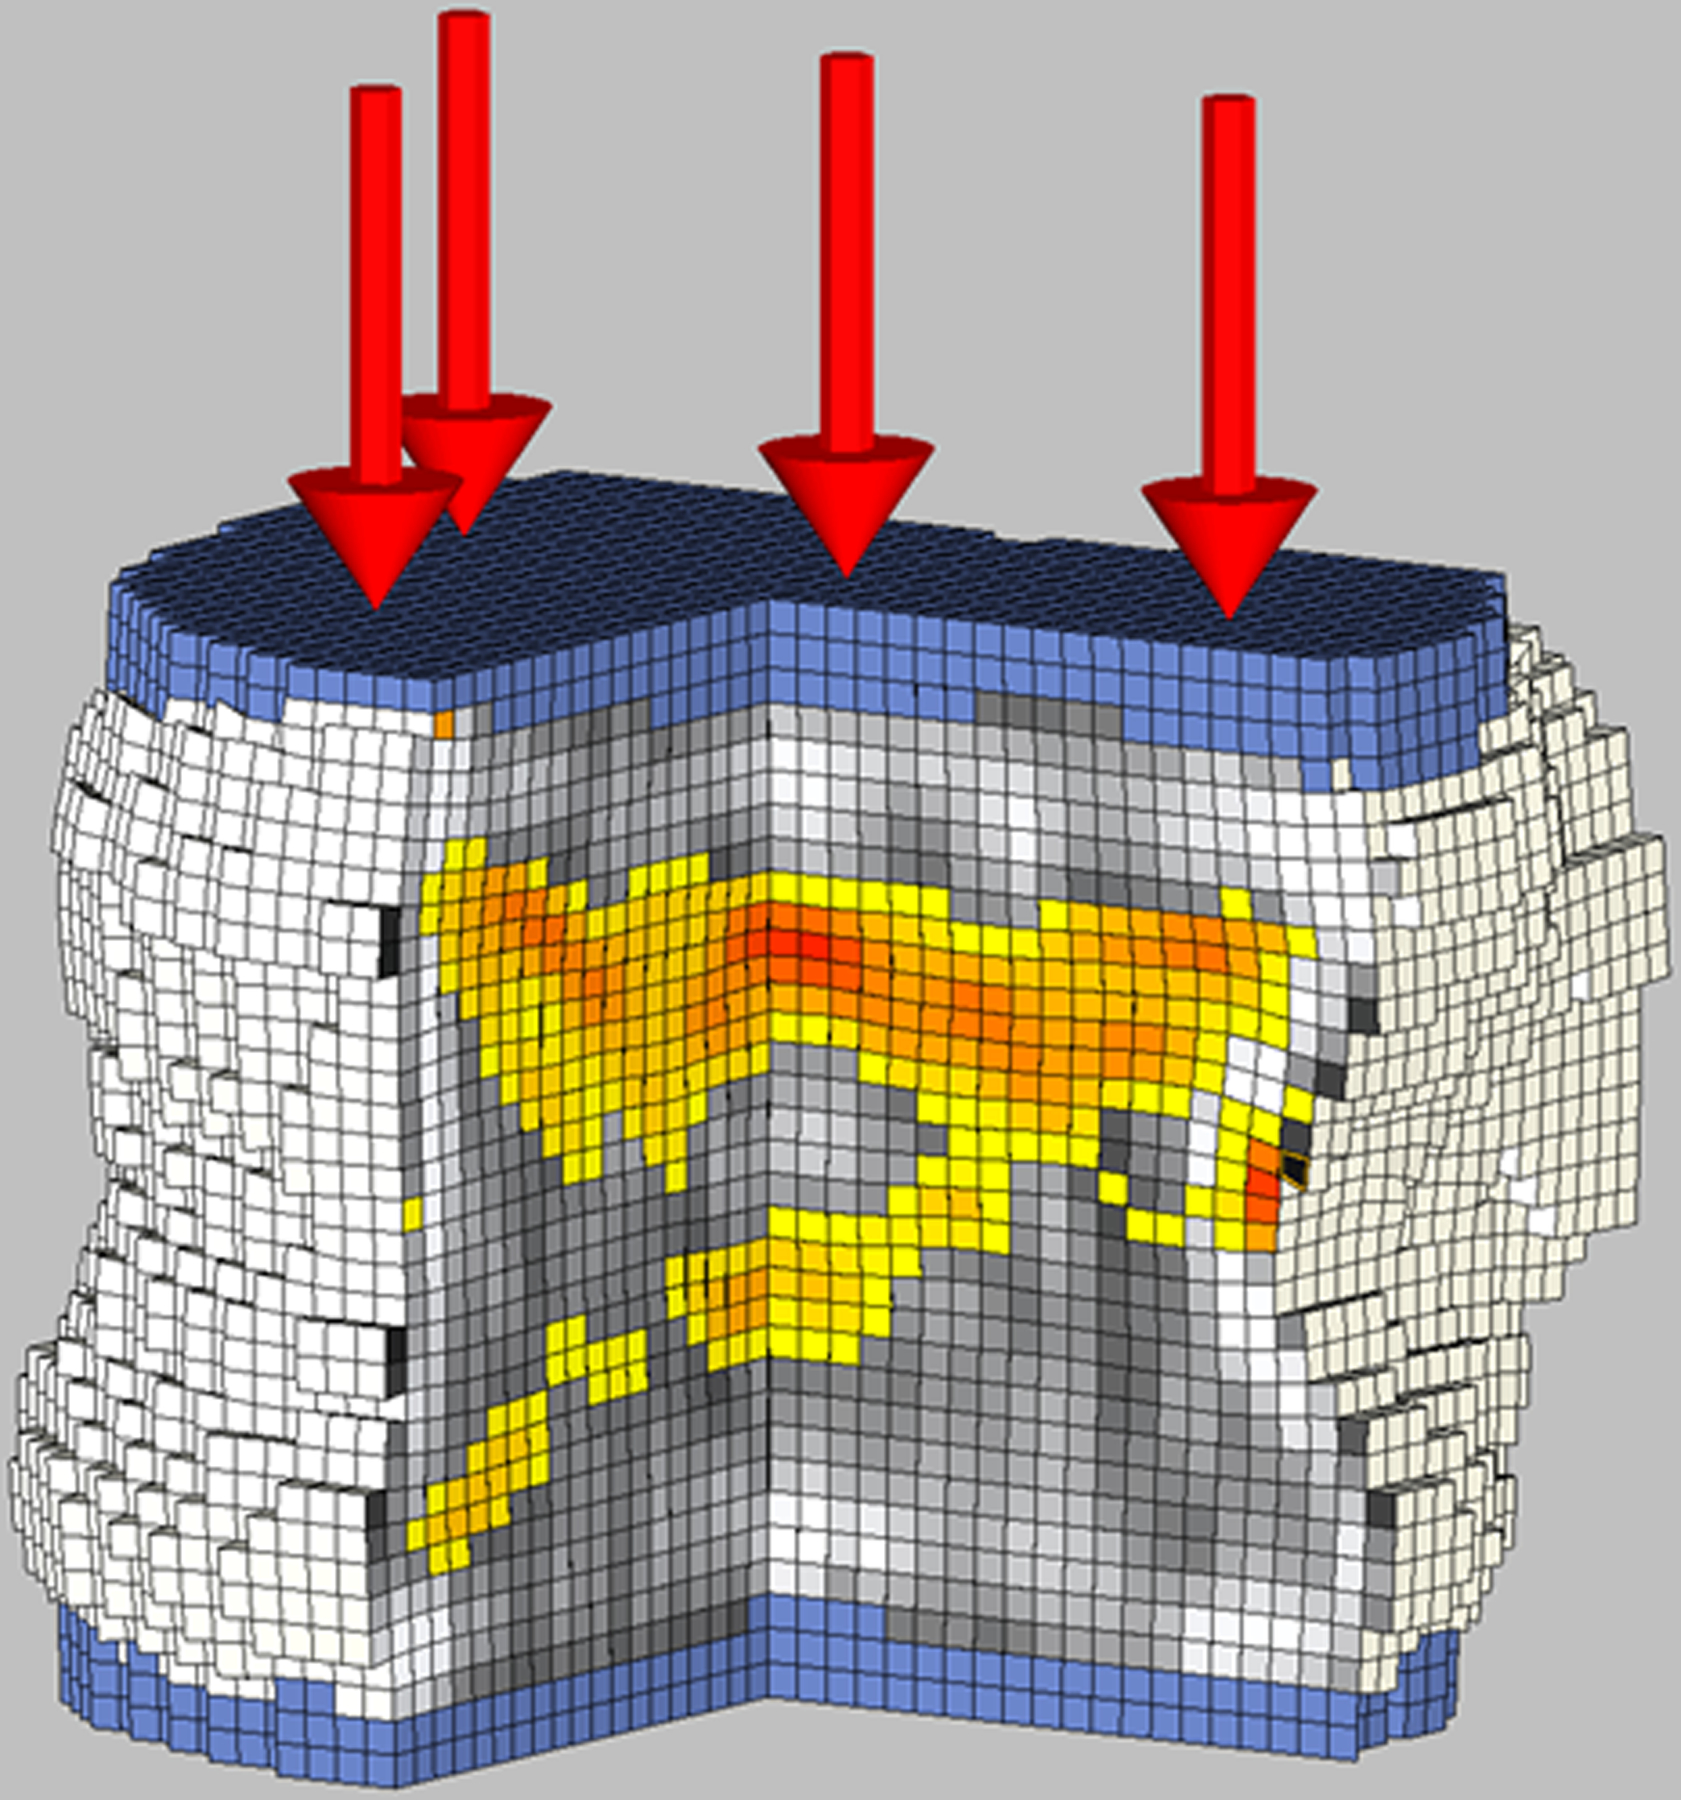
Biomechanical CT analysis of the L1 vertebral body in a 17-year-old female study participant with severe obesity (BMI: 39.7 kg/m2) who underwent sleeve gastrectomy.
A: Baseline evaluation before sleeve gastrectomy revelated bone strength of 9,260 N. Cut-out view of the finite element models under compressive load to failure depicts the distribution of BMD (black and white) and bone failure (colored areas). Red color indicates tissue that failed earlier during the compressive load (weaker bone). Shades of gray indicate different bone densities, with white being dense bone and black being little or no bone mineral.
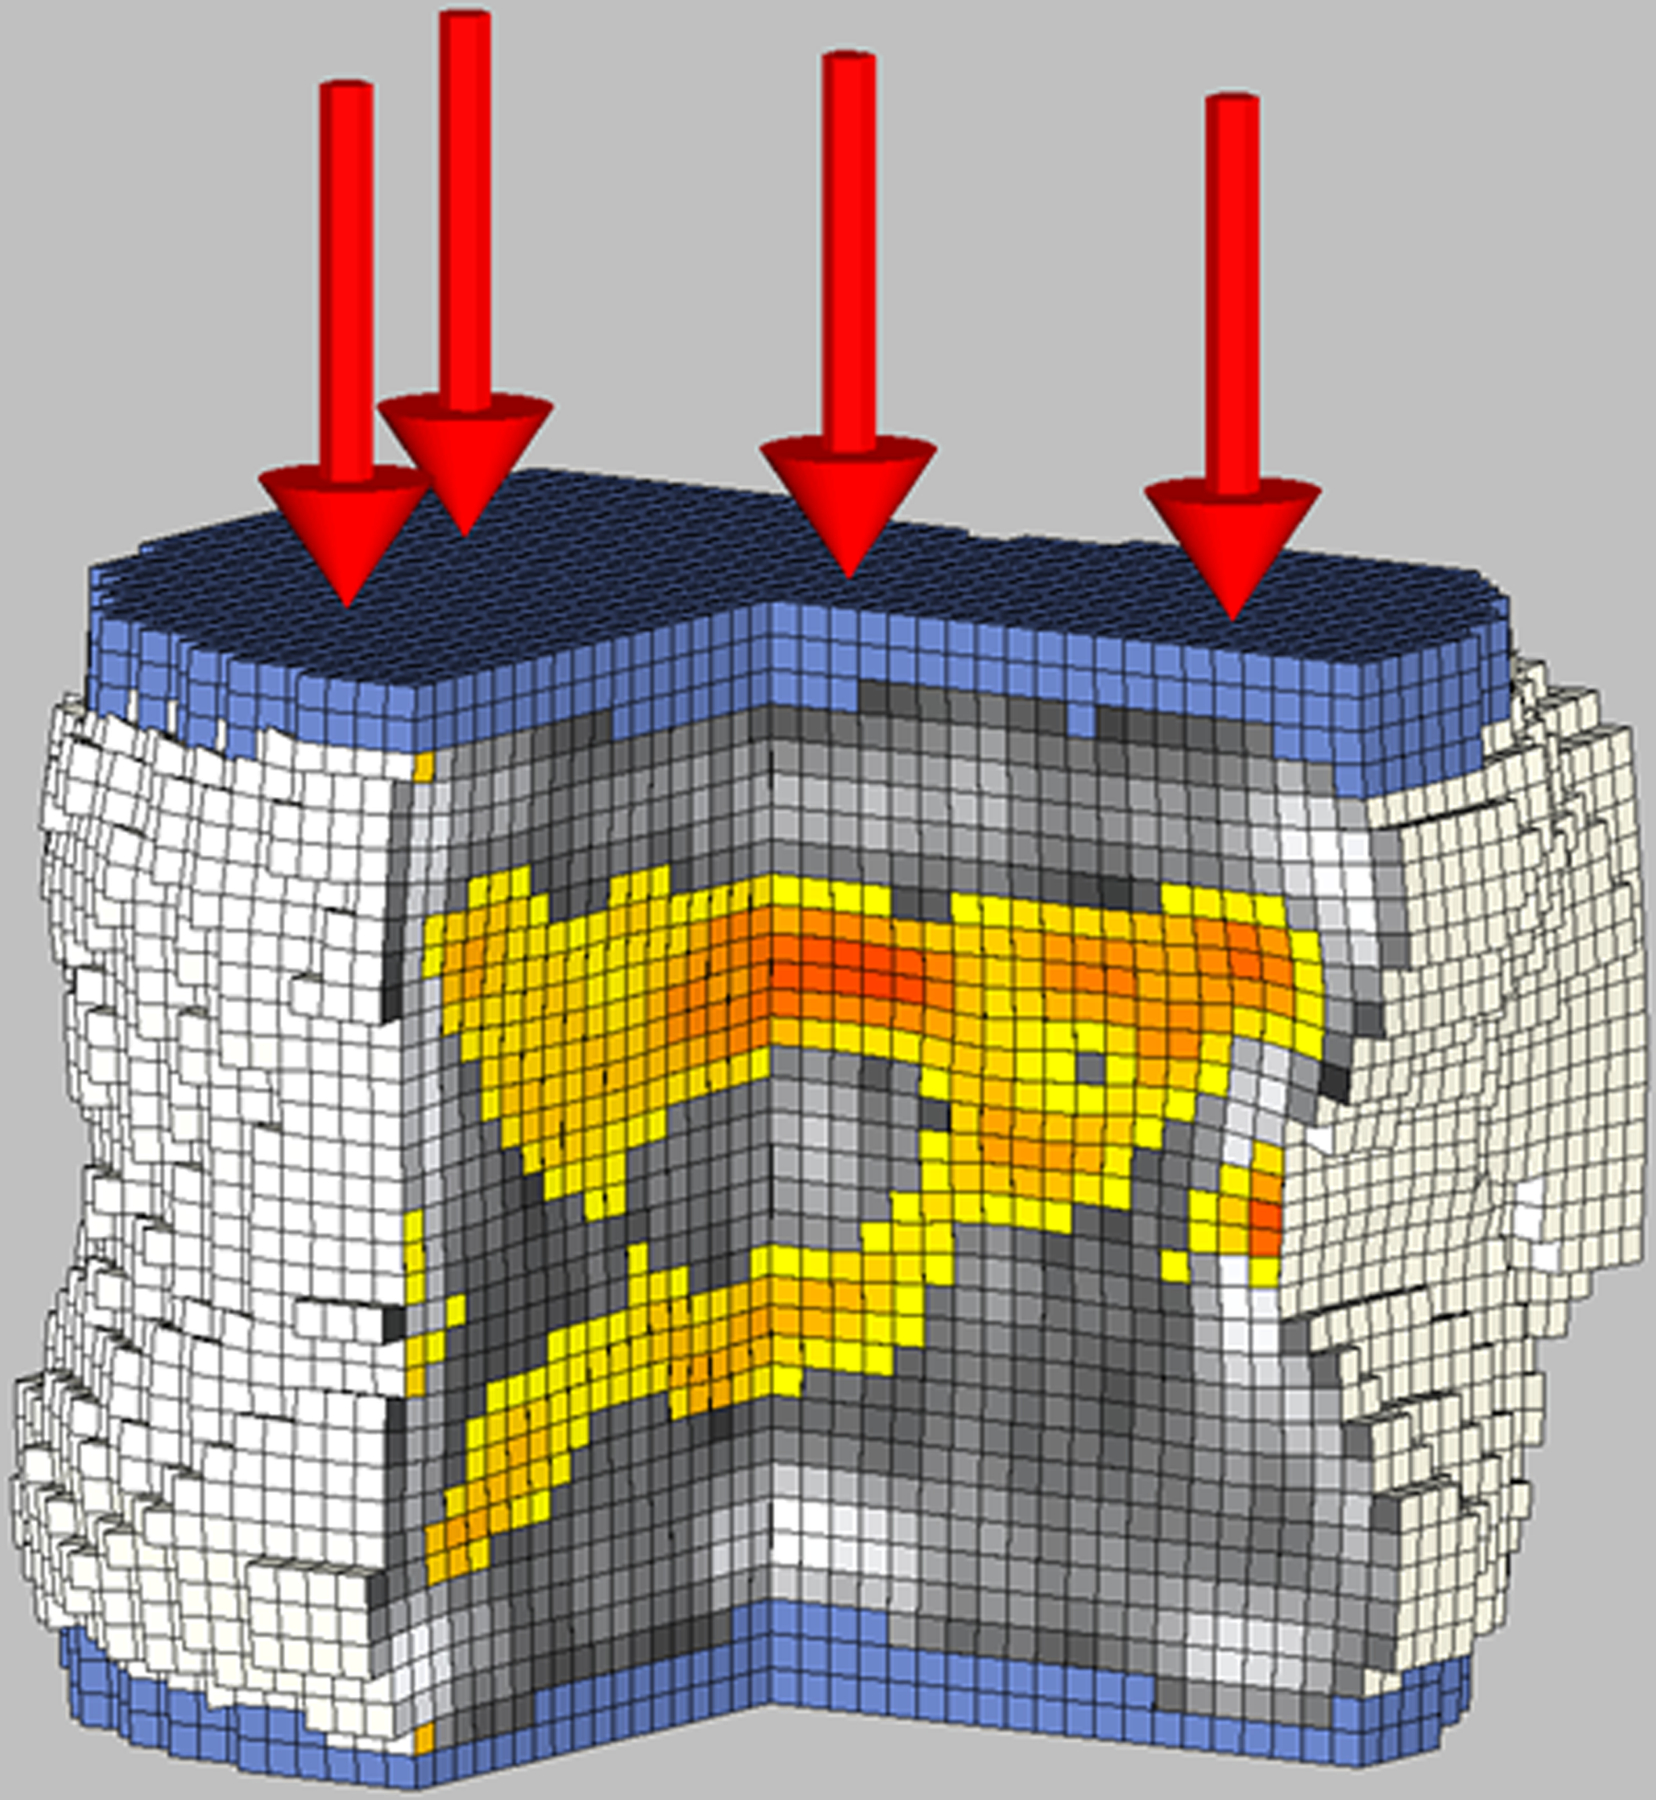
B: 12 months after sleeve gastrectomy, bone strength was 7,510N. Finite element models under compressive load to failure show an increase in the areas of bone failure (colored areas) and more red color, indicating tissue that failed earlier during the compressive load, and more gray areas indicting lower bone density.