
Figure 3.

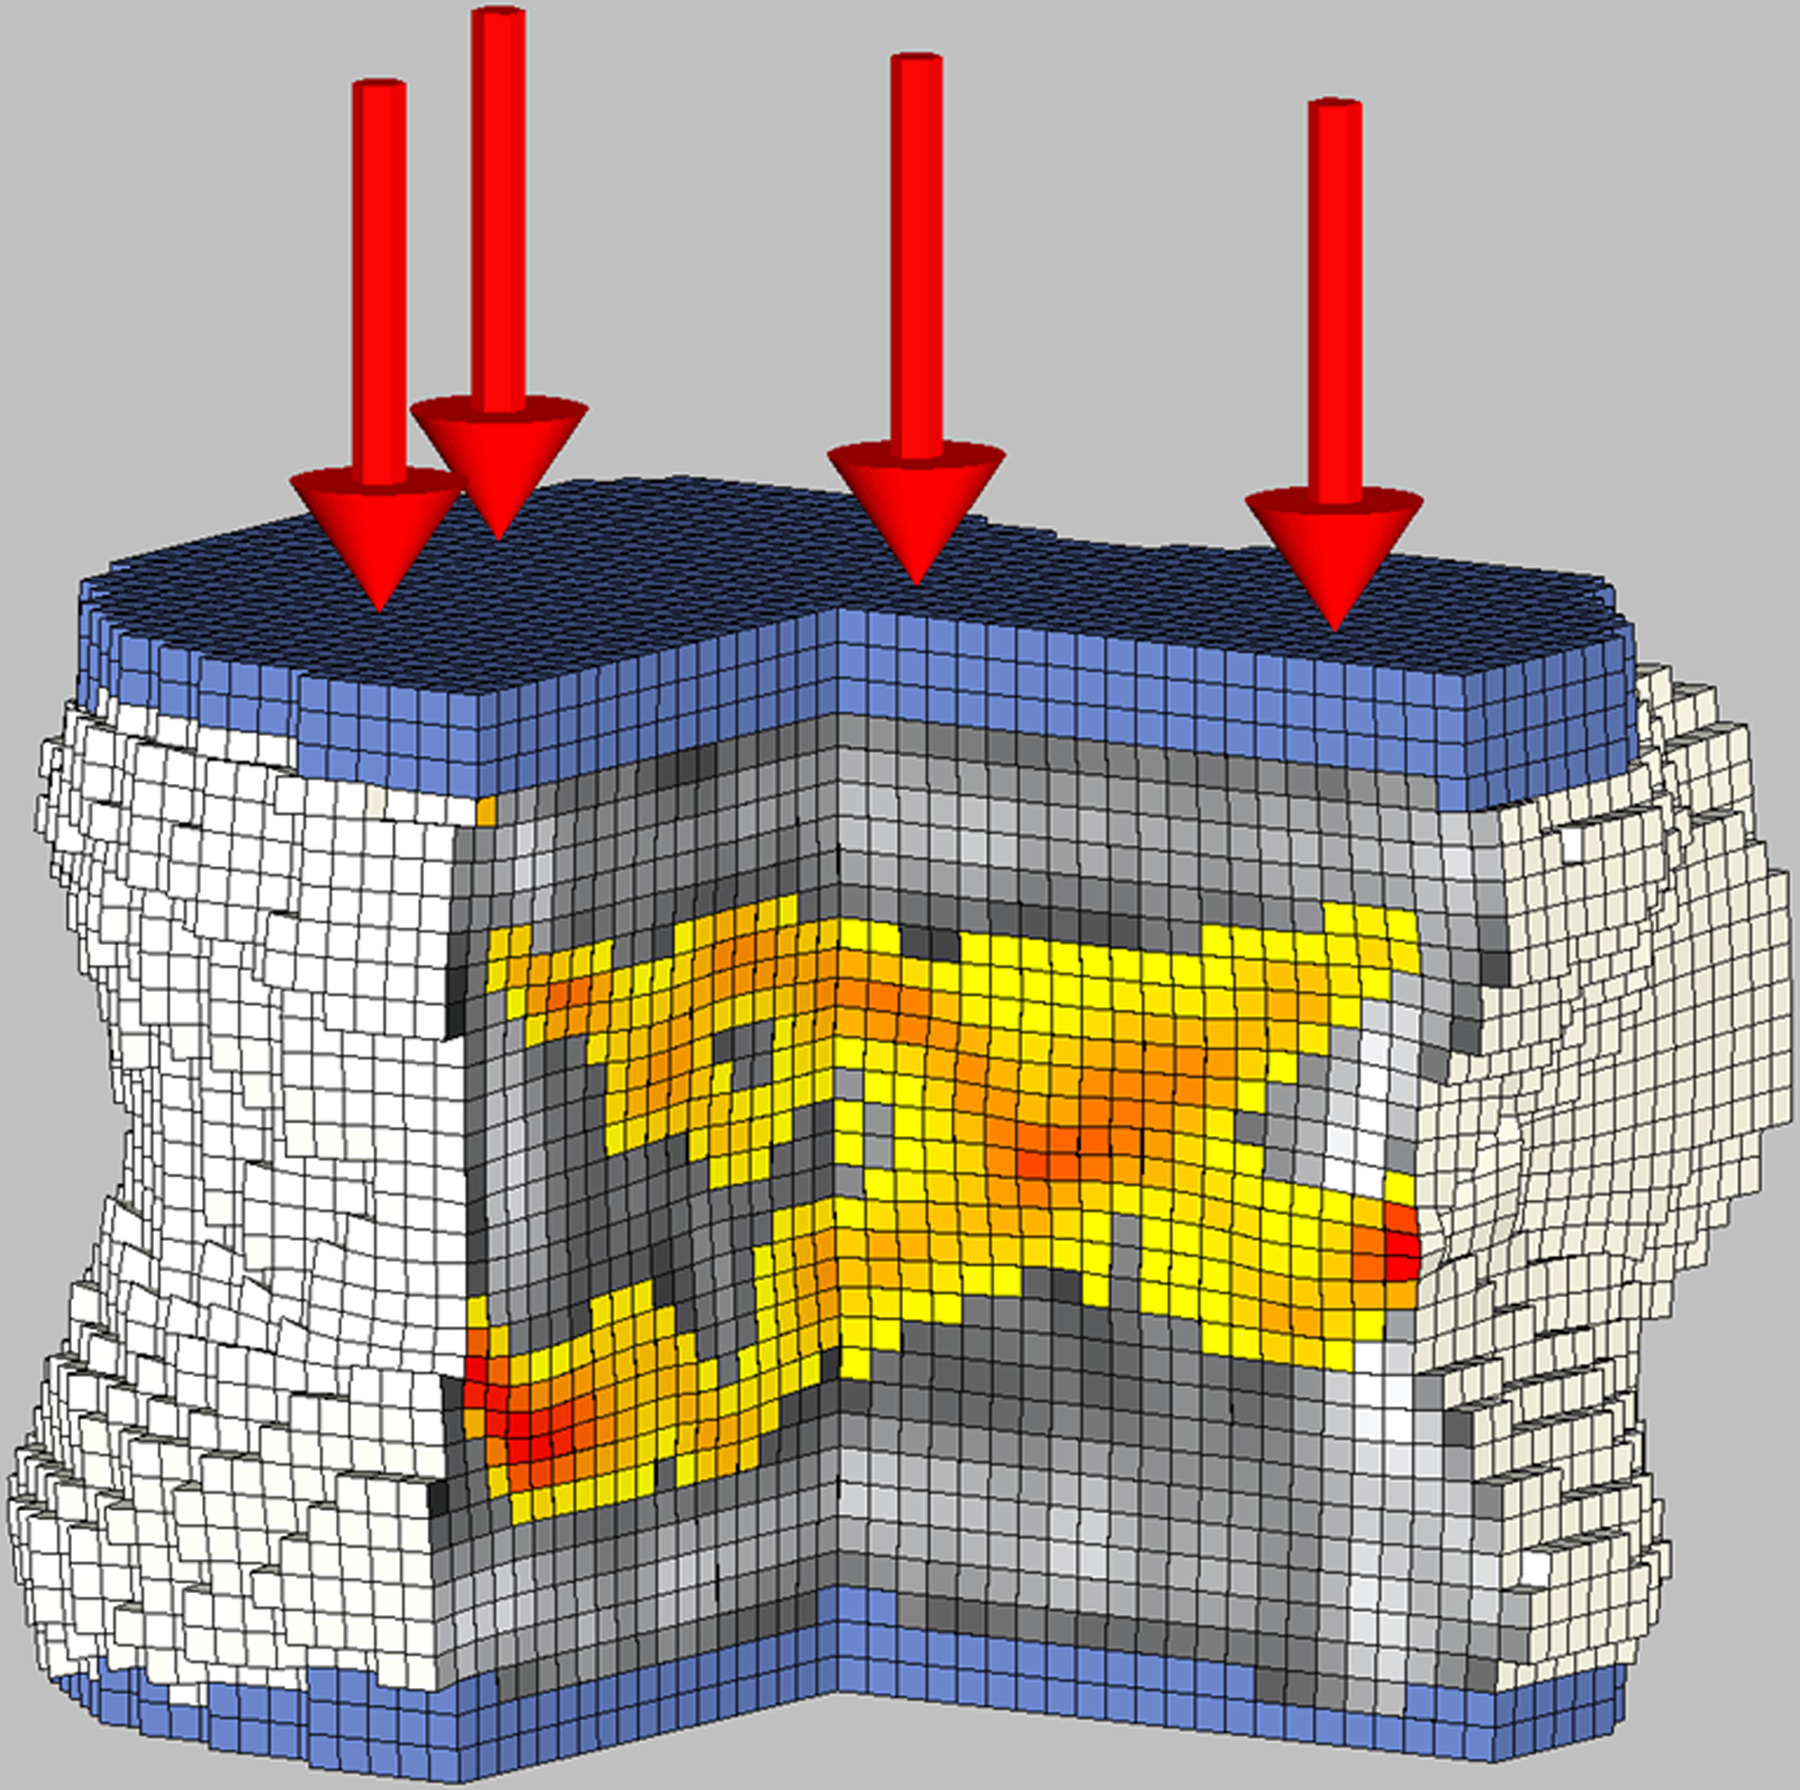
Biomechanical CT analysis of the L1 vertebral body in a 17-year-old female study participant with severe obesity (BMI: 46.9 kg/m2) who was followed with routine care.
A: Baseline evaluation revelated bone strength of 7,850 N. Cut-out view of the finite element models under compressive load to failure depicts the distribution of BMD (black and white) and bone failure (colored areas).
B: 12 months after routine care bone strength was 8,870 N. Finite element models under compressive load to failure show areas of bone failure (colored areas). Of note, areas that were red at baseline (early failure) became stronger at follow-up (more yellow color).