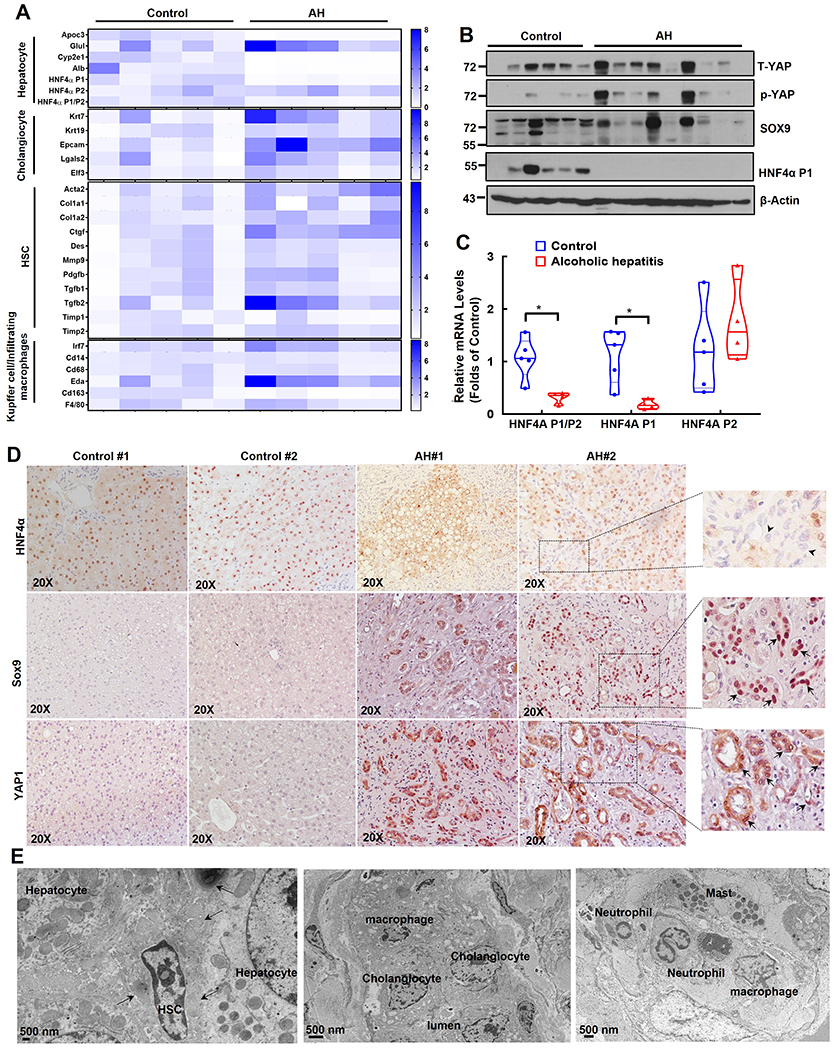
Figure 3. Decreased TSC1 protein levels associated with liver cell population reprogramming featured with increased fetal-like cells and decreased mature hepatocytes in human AH livers.

(A) Heat map of gene expression signatures for hepatocyte, cholangiocyte, HSC and Kupffer cell of qRT-PCR analysis. RNA was extracted from healthy donors (Control, n=5) and AH patient livers (n=5). Results were normalized to 18s and expressed as fold change compared with normal donors. (B) Total liver lysates from AH or healthy donors (control) were subjected to western blot analysis. (C) Gene expression of HNF4AP1, HNF4AP2 and HNF4AP1/P2 by qRT-PCR analysis. Data are presented as means ± SE (n=5). *p<0.05; Student t test. (D) Representative images of IHC staining for HNF4α, SOX9 and YAP1 in healthy donor (Control) and AH livers. Arrow heads: HNF4α negative ductular cells; arrows: SOX9 and YAP positive ductular cells. (E) Representative EM images of AH livers. Arrows denote collagen fibers.
