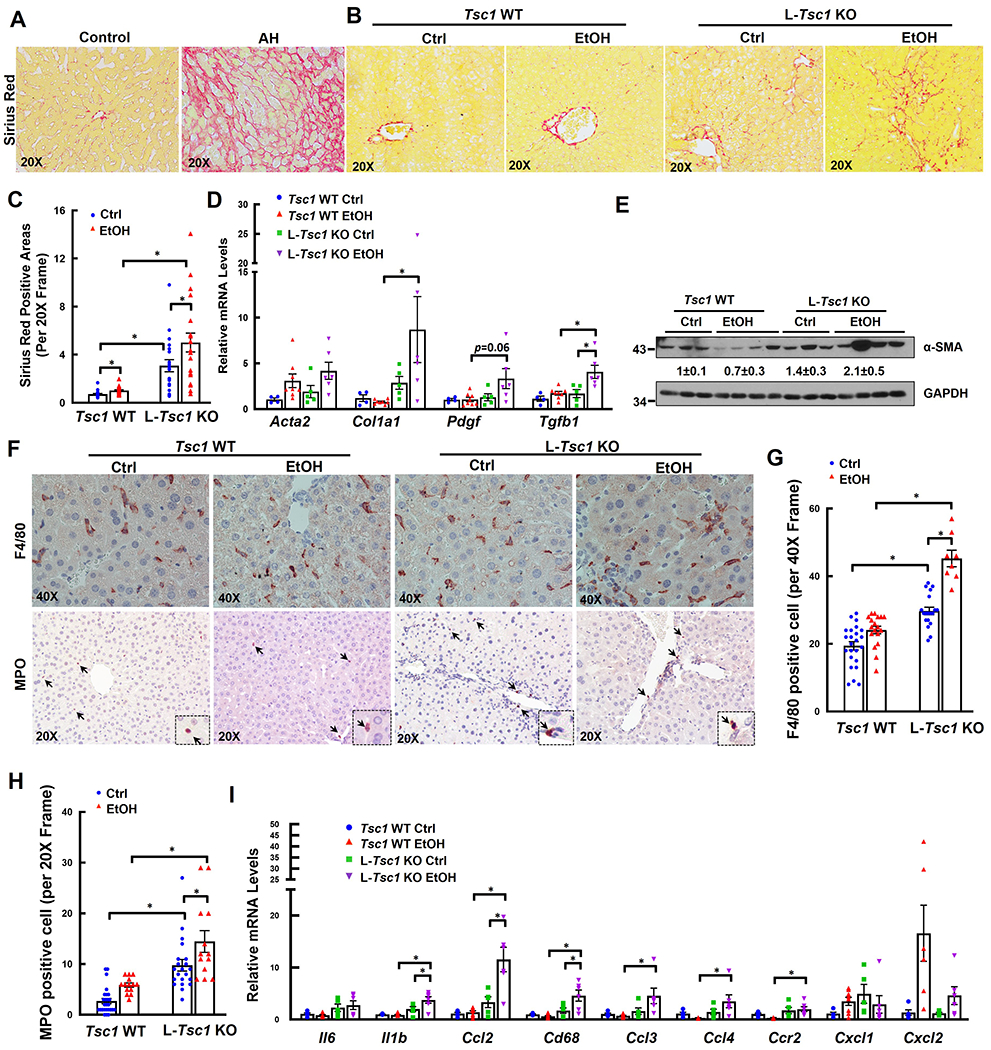
Figure 5. EtOH-fed L-Tsc1 KO mice exhibit increased fibrosis and inflammation.

(A) Representative photographs of Sirius Red staining from AH or healthy donor livers (Control) are shown. Male L-Tsc1 WT and L-Tsc1 KO mice were fed with Gao-binge alcohol. (B) Representative photographs of Sirius Red staining are shown. Down panels are enlarged photographs from the boxed area. (C) Quantification of Sirius Red positive areas. 20 different fields (20x) from each mouse were quantified in a blinded fashion using Image J. Data are presented as means ± SE (from n=3-4 mice). (D) qRT-PCR analysis of fibrogenic gene expression. RNA was extracted from mouse livers followed by qRT-PCR. Results were normalized to 18s and expressed as fold change compared with Tsc1 WT Ctrl group. Data are presented as means ± SE (n=4-8). *p<0.05; One-Way ANOVA analysis with Bonferroni post hoc test. (E) Total liver lysates were subjected to western blot and densitometry analysis. Data are presented as means ± SE (n= 3-4). (F) Representative photographs of IHC staining for F4/80 and myeloperoxidase (MPO). Arrows denote F4/80 and MPO positive cells. The numbers of F4/80 (G) and MPO (H) positive cells were quantified. 8 to 27 different fields (40x or 20x) from each mouse were quantified in a blinded fashion. Data are presented as means ± SE (from n=3-4 mice). *p<0.05; One-Way Anova analysis with Bonferroni post hoc test. (I) qRT-PCR analysis of inflammation gene expression. RNA was extracted from mouse livers followed by qRT-PCR. Results were normalized to 18s and expressed as fold change compared with L-Tsc1 WT Ctrl group (n=4-8). *p<0.05; One-Way Anova analysis with Bonferroni post hoc test.
