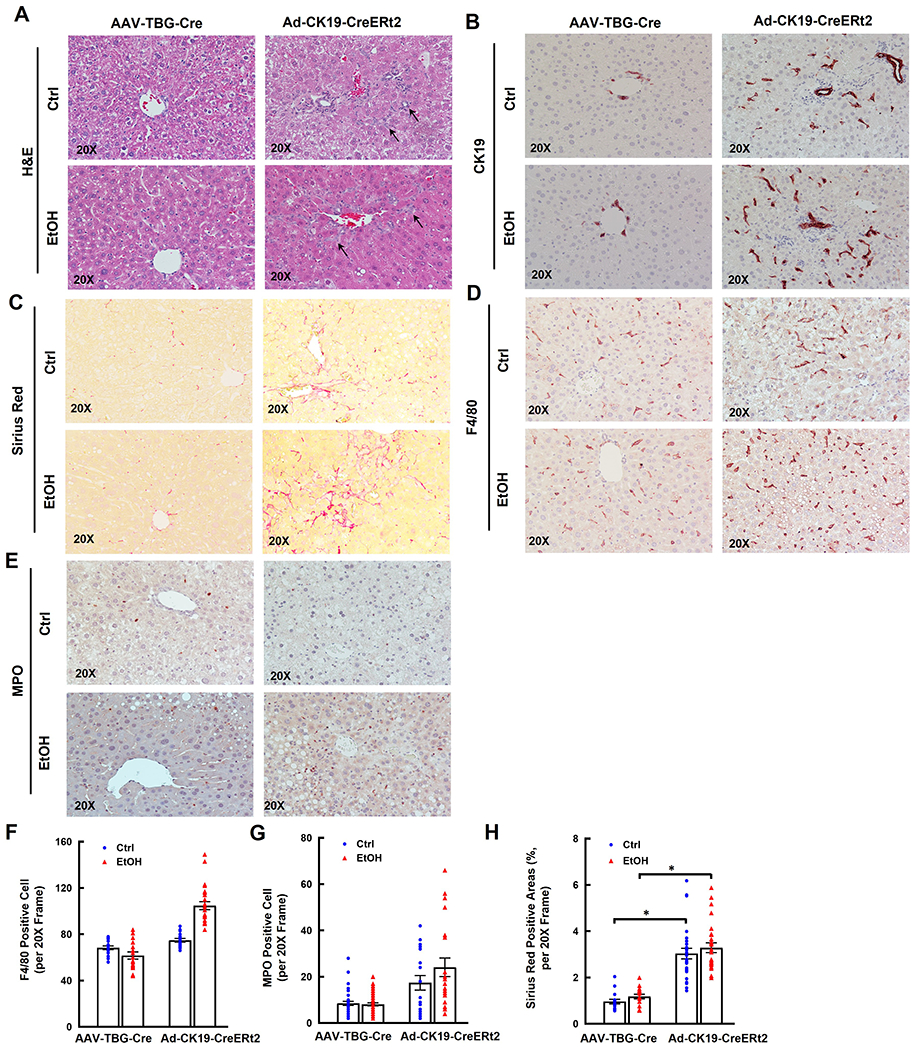
Figure 6. Cholangiocyte specific but not hepatocyte specific Tsc1 deletion increases DR, fibrosis and inflammatory cell infiltration in EtOH-fed mouse livers.

Tsc1flox/flox mice were injected with AAV8-TBG-Cre (1x10¹¹ GC/mouse through tail vein), or Ad-CK19-CreERt2 (2x10⁸ PFU/mouse through tail vein) and followed by tamoxifen (75 mg/kg, i.p.) for 3 days. All mice were subjected to Gao-binge feeding at eight weeks later after virus injection. Representative photographs of H&E staining (A) or IHC staining for CK19 (B), Sirius Red (C), F4/80 (D) and MPO staining (E) are shown. The numbers of F4/80 (F) and MPO (G) positive cells were quantified. More than 20 different fields (20x) from each mouse were quantified in a blinded fashion. Data are presented as means ± SE (from n=3-4 mice). (H) Sirius Red positive areas were quantified. 20 different fields (20x) from each mouse were quantified in a blinded fashion using Image J. Data are presented as means ± SE (from n=3-4 mice). *p<0.05; One-Way ANOVA analysis with Bonferroni post hoc test.
