
Figure 2.
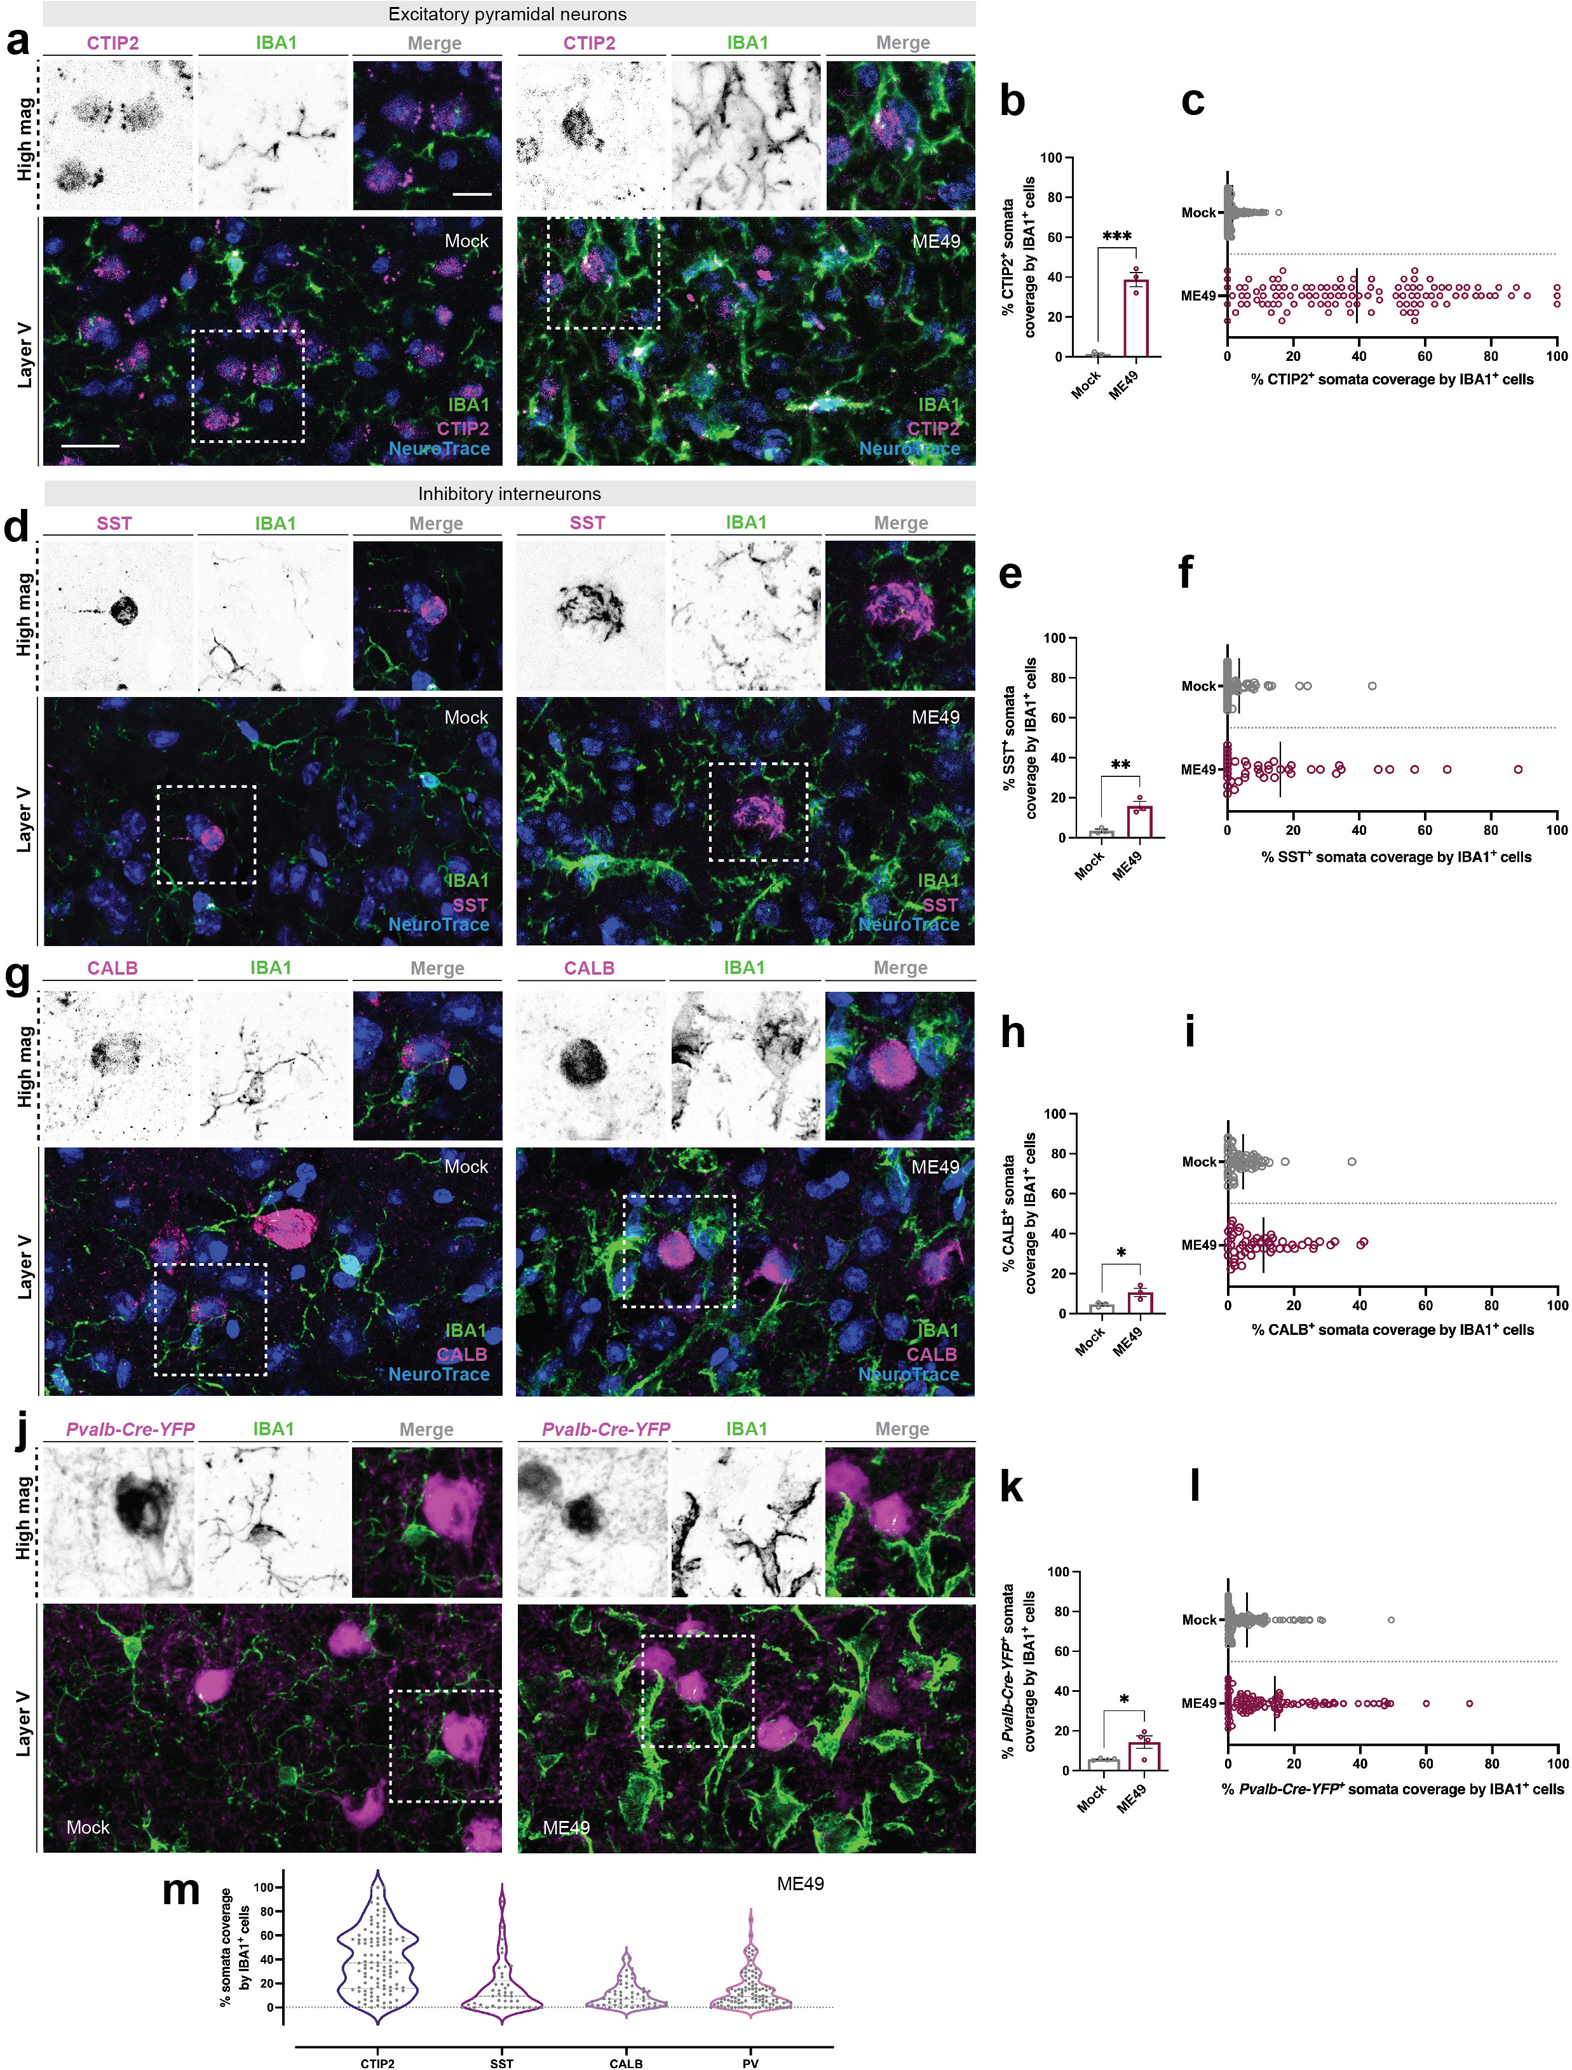
Excitatory pyramidal neurons are preferentially ensheathed by microglia
(a) Immunohistochemistry (IHC) for CTIP2 (which labels layer V neurons), NeuroTrace and IBA1 in layer V of neocortex at 30 days post infection (dpi) with Toxoplasma gondii (ME49) compared to mock-infection (Mock).
(b) Quantification of CTIP2+ NeuroTrace+ soma coverage by IBA1+ cells in mock- and ME49-infected neocortex. Each data point represents the average of one biological replicate and bars depict mean ± standard error of the mean (SEM). Asterisks (***) indicate P < 0.001 by Student’s two-tailed t-test (n=3 mice per condition). P value = 0.0003; t = 10.28; df = 4. Normality assessed by F-test (F value = 7.007, P value = 0.2398, not significant).
(c) Distribution plot of individual CTIP2+ NeuroTrace+ somata analyzed and pooled from biological replicates in (B). Bar represents mean percent somata coverage by all IBA1+ cells.
(d) IHC for SST, NeuroTrace, and IBA1 in layer V of neocortex (ME49) compared to mock-infection (Mock).
(e) Quantification of SST+ NeuroTrace+ soma coverage by IBA1+ cells in mock- and ME49-infected neocortex. Each data point represents the average of one biological replicate and bars depict mean ± SEM. Asterisks (**) indicate P < 0.01 by Student’s two-tailed t-test (n=3 mice per condition). P value = 0.0065; t = 5.202; df = 4. Normality assessed by F-test (F value = 41.22, P value = 0.0474, significant).
(f) Distribution plot of individual SST+ NeuroTrace+ somata analyzed and pooled from biological replicates in (E). Bar represents mean percent somata coverage by all IBA1+ cells.
(g) IHC for CALB, NeuroTrace, and IBA1 in layer V of neocortex (ME49) compared to mock-infection (Mock).
(h) Quantification of CALB+ NeuroTrace+ soma coverage by IBA1+ cells in mock- and ME49-infected neocortex. Each data point represents the average of one biological replicate and bars depict mean ± SEM. Asterisks (*) indicate P < 0.05 by Student’s two-tailed t-test (n=3 mice per condition). P value = 0.0479; t = 2.819; df = 4. Normality assessed by F-test (F value = 9.209, P value = 0.1959, not significant).
(i) Distribution plot of individual CALB+ NeuroTrace+ somata analyzed and pooled from biological replicates in (H). Bar represents mean percent somata coverage by all IBA1+ cells.
(j) IHC for IBA1 in Pvalb-Cre-YFP shows minimal ensheathment of PV+ inhibitory interneurons in layer V of neocortex at 30 dpi (ME49) compared to mock-infection (Mock).
(k) Quantification of Pvalb-Cre-YFP+ soma coverage by IBA1+ cells in mock- and ME49-infected neocortex. Each data point represents the average of one biological replicate and bars depict mean ± SEM. Asterisks (*) indicate P < 0.05 by Student’s two-tailed t-test (n=4 mice per condition). P value = 0.0324; t = 2.770; df = 6. Normality assessed by F-test (F value = 167.4, P value = 0.0016, significant).
(l) Distribution plot of individual Pvalb-Cre-YFP+ somata analyzed and pooled from biological replicates in (K). Bar represents mean percent somata coverage by all IBA1+ cells.
(m) Violin-plot showing the distribution of ensheathment by IBA1+ phagocytes (as a % of somal coverage) for 4 types of neocortical neurons (Data from c, f, i, l).
Scale bars in A, D, G, J: 20 μm and in A, D, G, J high magnification images: 10 μm