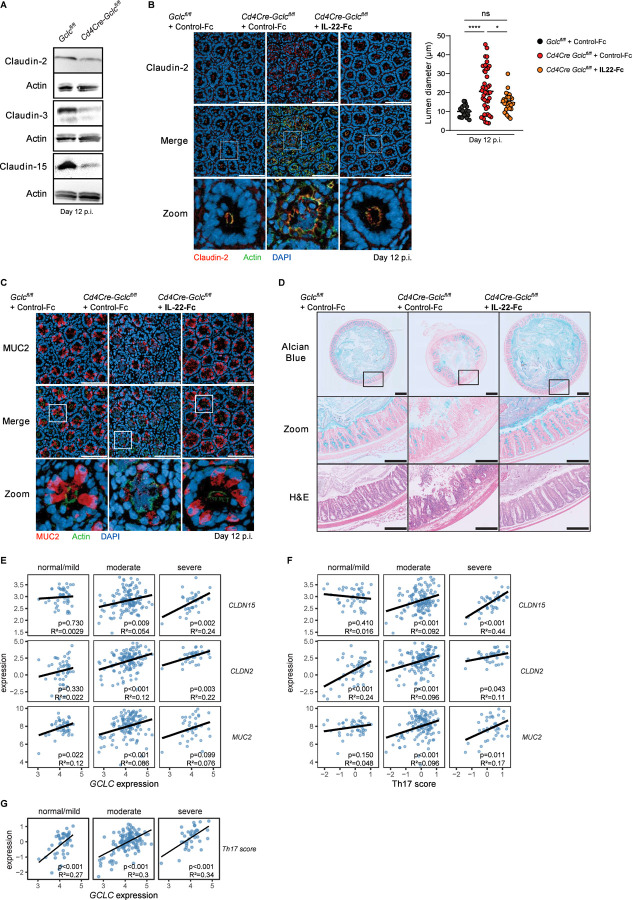
Figure 5: Gclc deficiency is linked to defects in intestinal tight junctions and mucus in C. rodentium-infected mice and IBD patients.
(A) Representative immunoblots to detect the indicated claudin proteins in distal colon segments of C. rodentium-infected Gclcfl/fl and Cd4Cre Gclcfl/fl mice at day 12 p.i. Actin, loading control. Data are representative of 3 mice/genotype.
(B) Left: Top and middle: Immunofluorescence microscopy of cross-sections of colonic crypts from distal colon segments that were collected at day 12 p.i. from C. rodentium-infected Gclcfl/fl and Cd4Cre Gclcfl/fl mice treated i.v. with IL-22-Fc or control-Fc at days −1, 3, 6, 9, p.i. Sections were stained to detect claudin-2 (red), F-actin (green) and DNA (blue). Data are representative of 6 mice/genotype. Scale bars, 100µm. Bottom: “Zoom” panels are higher magnification views of boxed areas in the middle panels. Right: Quantification of lumen diameters of 24–43 crypts measured per mouse in the left panel. Data are representative of 6 mice/genotype.
(C) Top and middle: Immunofluorescence microscopy of cross-sections of colonic crypts from distal colon segments in (B) were stained to detect MUC2 (red), F-actin (green) and DNA (blue). Data are representative of 6 mice/genotype. Scale bars, 100µm. Bottom: “Zoom” panels are higher magnification views of boxed areas in the middle panel.
(D) Top: Alcian blue-stained cross-sections of distal colon segments that were collected at day 12 p.i. from C. rodentium-infected Gclcfl/fl and Cd4Cre Gclcfl/fl mice treated i.v. with IL-22-Fc or control-Fc at days −1, 3, 6, 9, p.i. Data are representative of 3 mice/genotype. Scale bars, 500µm. Middle: “Zoom” panels are higher magnification views of the boxed areas in the top panels. Scale bars, 200µm. Bottom: H&E staining of the sections in the middle panels. Scale bars, 200µm.
(E, F) Bioinformatics analyses of RNA sequencing data of rectal biopsies from ulcerative colitis (UC) patients. The provided MAYO scores were used to define the disease severity as normal/mild, moderate and severe disease (Teixeira et al., 2015). Significance and r2 values are indicated in the lower right corner of each frame. (E) Correlation of GCLC expression with the epithelial integrity markers claudin-15 (CLDN15) (top), claudin-2 (CLDN2) (middle), and mucin 2 (MUC2) (bottom). (F) Correlation of the Th17 score with the epithelial integrity markers claudin-15 (CLDN15) (top), CLDN2 (middle), and MUC2 (bottom). The Th17 score was defined as the mean of scaled log2 gene expression values composing the signature (IL-17A, IL-17F, IFN-γ, CD3E, CD4, STAT3, STAT5a, STAT1, STAT4, STAT6, AHR, RORC, RORA and TBX21).
(G) Bioinformatics analysis of RNA sequencing data of UC rectal biopsies as in (E,F) showing correlation of GCLC expression with Th17 score.

