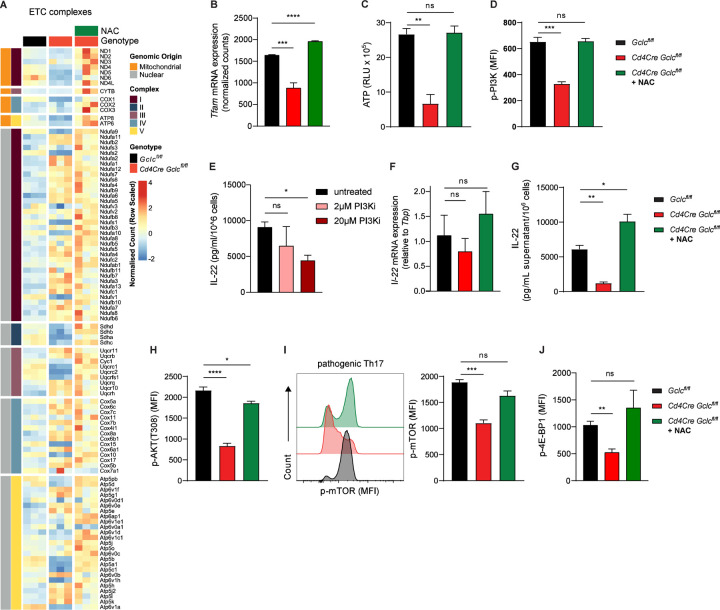
Figure 7: Gclc connects mitochondrial gene expression and mitochondrial function with IL-22 protein translation in Th17 cells.
(A-J) Naïve T cells were sorted from spleen and lymph nodes of Gclcfl/fl and Cd4Cre Gclcfl/fl mice and induced to differentiate in vitro into pathogenic Th17 cells by culture with anti-CD3, anti-CD28, IL-6, IL-1β and IL-23. Cells were treated with 10mM NAC as indicated.
(A-B) Bulk RNA seq was performed. (A) Heatmap representing GO:0022900 Electron transport Chain. (B) Tfam expression. (n=3).
(C) Quantification of total ATP levels in Gclcfl/fl and Cd4Cre Gclcfl/fl in vitro-differentiated Th17 cells as measured in RLU. Data are mean±SEM (n=3); 2 trials.
(D) Quantification of FCA of p-PI3K in in vitro-differentiated Gclcfl/fl and Cd4Cre Gclcfl/fl Th17 cells. Data are mean±SEM (n=3); 2 trials.
(E) IL-22 protein concentrations as measured by ELISA in culture supernatants of in vitro-differentiated C57BL/6J WT Th17 cells treated with PI3K inhibitor (LY294002) for last 24 hours of differentiation. Data are mean±SEM (n=3).
(F) Quantification of qPCR determination of IL-22 mRNA expression of in vitro-differentiated Gclcfl/fl and Cd4Cre Gclcfl/fl Th17 cells. Data are mean±SD (n=3–4).
(G) IL-22 protein concentrations as measured by ELISA in culture supernatants of in vitro-differentiated Gclcfl/fl and Cd4Cre Gclcfl/fl Th17 cells. Data are mean±SEM (n=3); 2 trials.
(H) Quantification of FCA of p-AKT in in vitro-differentiated Gclcfl/fl and Cd4Cre-Gclcfl/fl Th17 cells. Data are mean±SEM (n=3); 2 trials.
(I) Left: FCA to detect p-mTOR in in vitro-differentiated Gclcfl/fl and Cd4Cre-Gclcfl/fl Th17 cells. Right: Quantification of left panel results. Data are mean±SEM (n=3); 3 trials.
(J) Quantification of FCA of p-4E-BP1 in in vitro-differentiated Gclcfl/fl and Cd4Cre-Gclcfl/fl Th17 cells. Data are mean±SEM (n=3); 2 trials.

