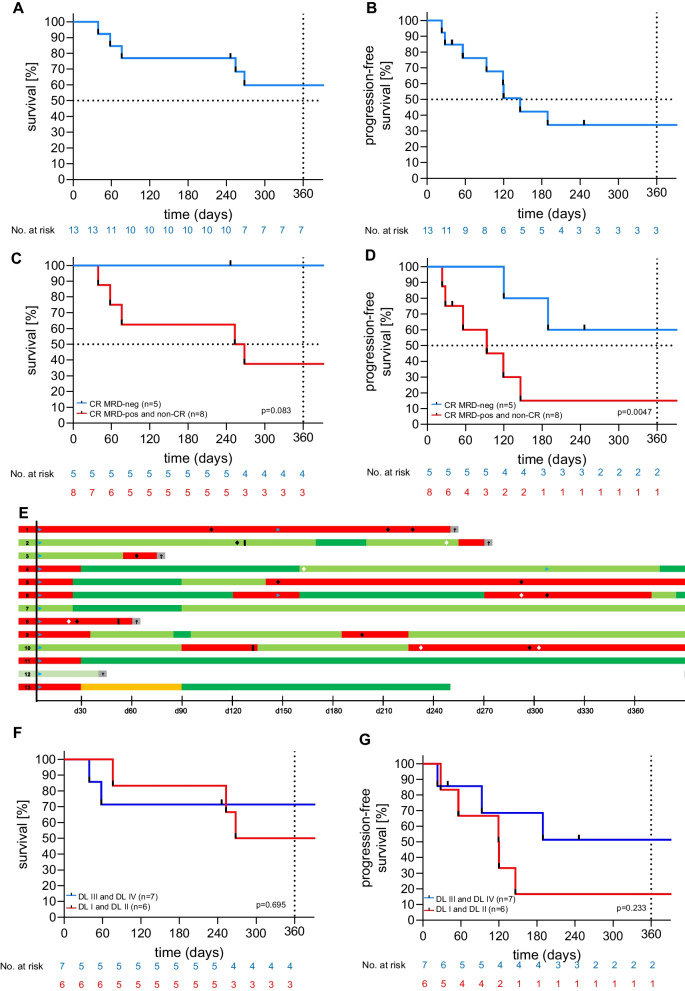
Fig. 3.
Efficacy of HD-CAR-1 treatment and patient outcome. A Overall survival (OS) and B progression-free survival (PFS) of treated patients. C OS and D PFS at end of study (EOS) on day 90 after HD-CAR-1 CART administration of HD-CAR-1 patients that achieved complete remission (CR; blue) vs. non-responders (red; partial remission (PR), stable disease (SD), progressive disease (PD). E Swimmer plot depicting the course of individual HD-CAR-1 patients. F OS and G PFS according to administered HD-CAR-1 CART dose (dose level (DL); DL1: 1 × 10⁶ CARTs/m2 (n = 3), DL2 5 × 10⁶ CARTs/m2 (n = 3), DL3 20 × 106 CARTs/m2 (n = 4), DL4: 5 × 10⁷ CARTs/m2 (n = 3)). DL: dose level; CR: complete remission; and MRD (minimal residual disease).
 : CART therapy.
 : allogeneic stem cell transplantation.
 : antibody treatment.
 : chemotherapy.
 : progressive disease (PD),
 : partial remission (PR),
 : stable disease (SD),
 : MRD-positive complete remission (CR),
 : MRD-negative complete remission/metabolic CR (CR*), †: death

