Extended Data Fig.8.
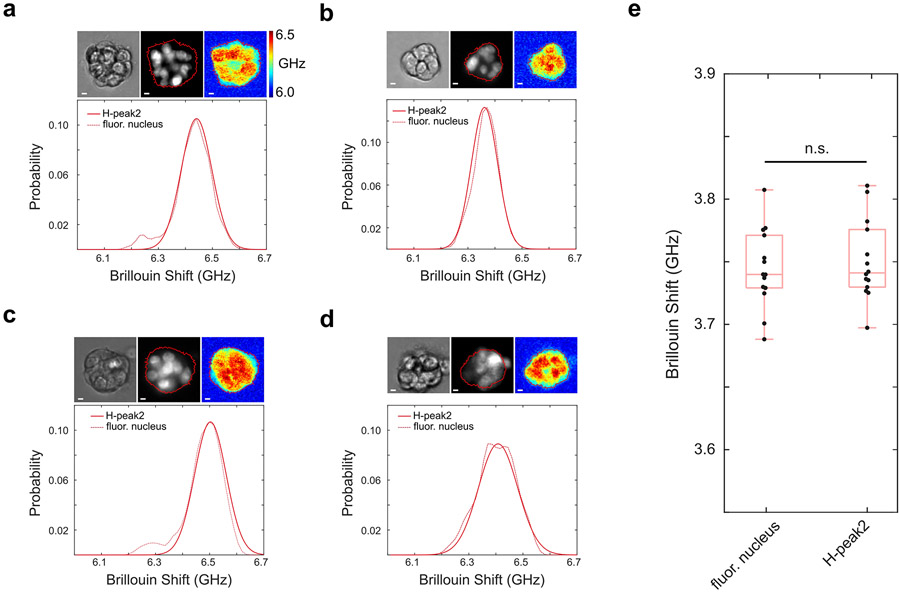
Analysis of subcellular mechanical information of spheroids. a-d, Co-registered fluorescence and Brillouin images of four representative spheroids. Each sub figure shows the bright field image, fluorescence image of the nuclei, and the Brillouin image acquired by the CBM, respectively. Red line in the image outlines the profile of the spheroid. The plots of ‘H-peak 2’ is the right peak extracted from the curve fitting of the Brillouin shift histogram. The plots of ‘fluor. nucleus’ represents Brillouin shift of the nucleus region. e, Results of all the spheroid samples (n=14). The perfect overlap of the ‘H-peak 2’ and ‘fluor. nucleus’ confirms the dLSBM can acquire the mechanical information of the nucleus based on the histogram plot of Fig. 1e. n.s.: not statistically significant. Statistical significance is determined by performing two-sided two-sample t-test, and no adjustment was made. In all boxplots, the central mark indicates the median, and the bottom and top edges indicate the 25th and 75th percentiles, respectively. The whiskers extend to the most extreme data points not considered outliers.

