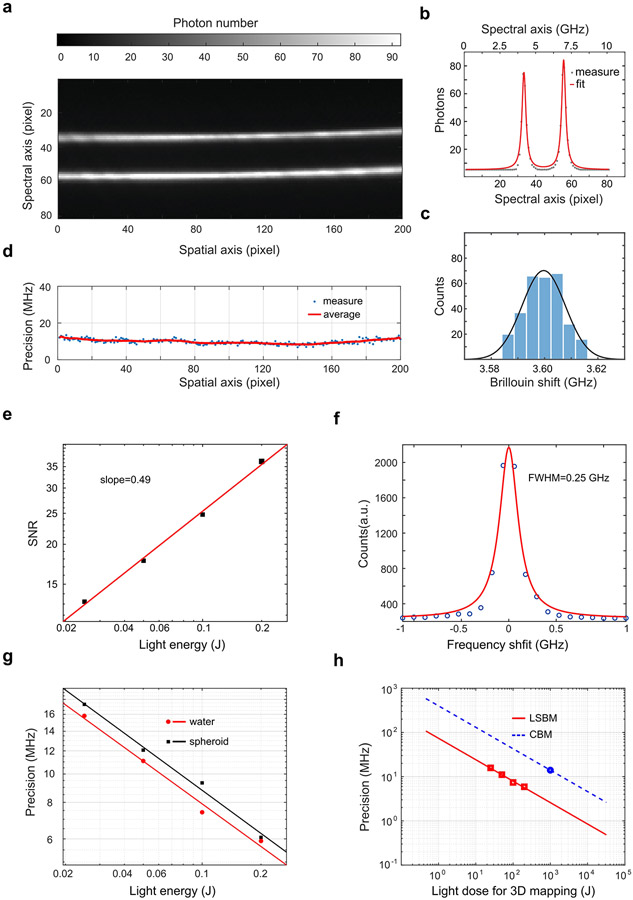
Extended Data Fig.4.
Characterization of Brillouin spectrometer. a, Exemplary raw Brillouin spectrum of DI water acquired by the spectrometer of the dLSBM setup with single-line illumination. b, Brillouin shift is extracted by fitting the spectrum of a single pixel with a Lorentzian function. Peaks represent the Stokes and anti-Stokes components of the Brillouin frequency. c, Representative histogram distribution of the estimated Brillouin shift of the same point after repeated acquisition (n=300). The solid line is fitting result by Gaussian profile. The standard deviation of the estimated Brillouin shift is 8 MHz. d, Spectral precision of all points on illumination axis. The average is 9.8 MHz. e, Signal-to-noise (SNR) ratio against light energy of dLSBM spectrometer for water sample. The fitted line with a slope of ~ 0.5 under log-log scale indicates the spectrometer is operating under shot-noise limited condition. f, The spectral resolution is measured to be 0.25 GHz. Circles are measured data, and solid line is Lorentzian fit. g, Spectral precision against light energy of the dLSBM spectrometer in water and spheroid sample, suggesting the spectrometer is shot noise limited in both conditions. h, Comparison of dLSBM and confocal Brillouin microscopy (CBM) regarding the spectral precision against total light dose for 3D mapping of 100×200×10 pixels. water is used as sample. The data point of CBM is adapted from reference [28], and the dash line indicates the shot noise limited operation.

