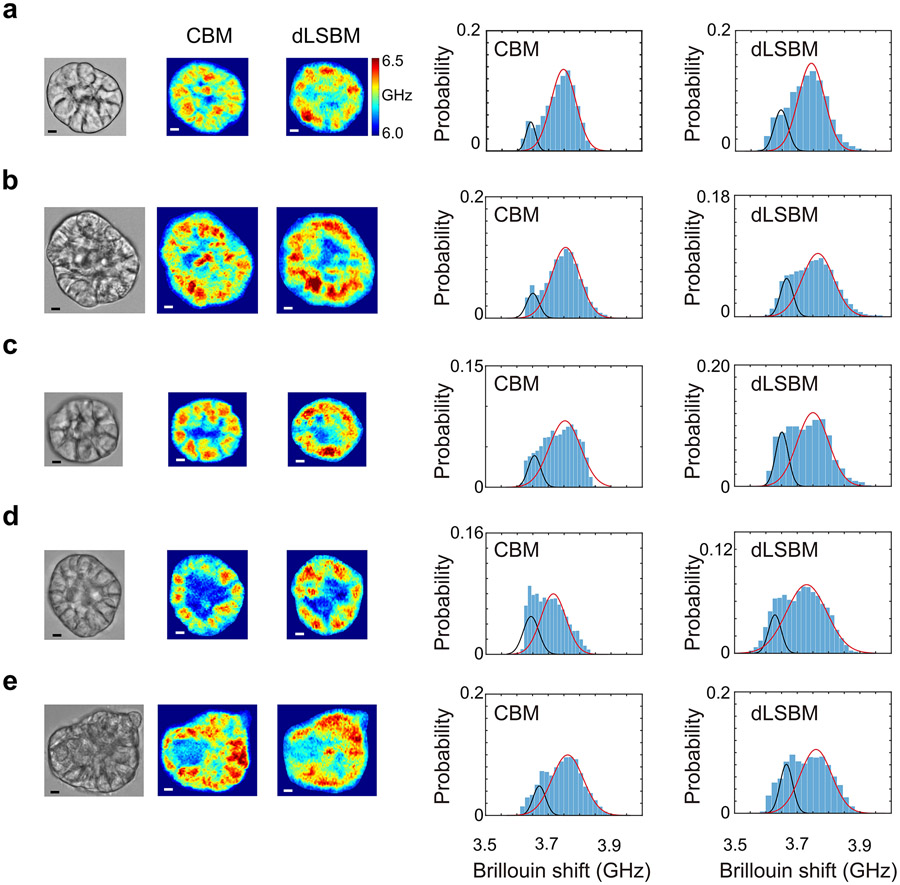
Extended Data Fig.7.
Comparison of dLSBM and CBM. a-e, five independent spheroids measured by dLSBM (NA=0.3) and CBM (NA=0.4). Scale bar is 5 μm. For each spheroid, the Brillouin shifts of all pixels from the image was plotted into a histogram. The histogram was then fitted by a combination of two Gaussian distributions.

