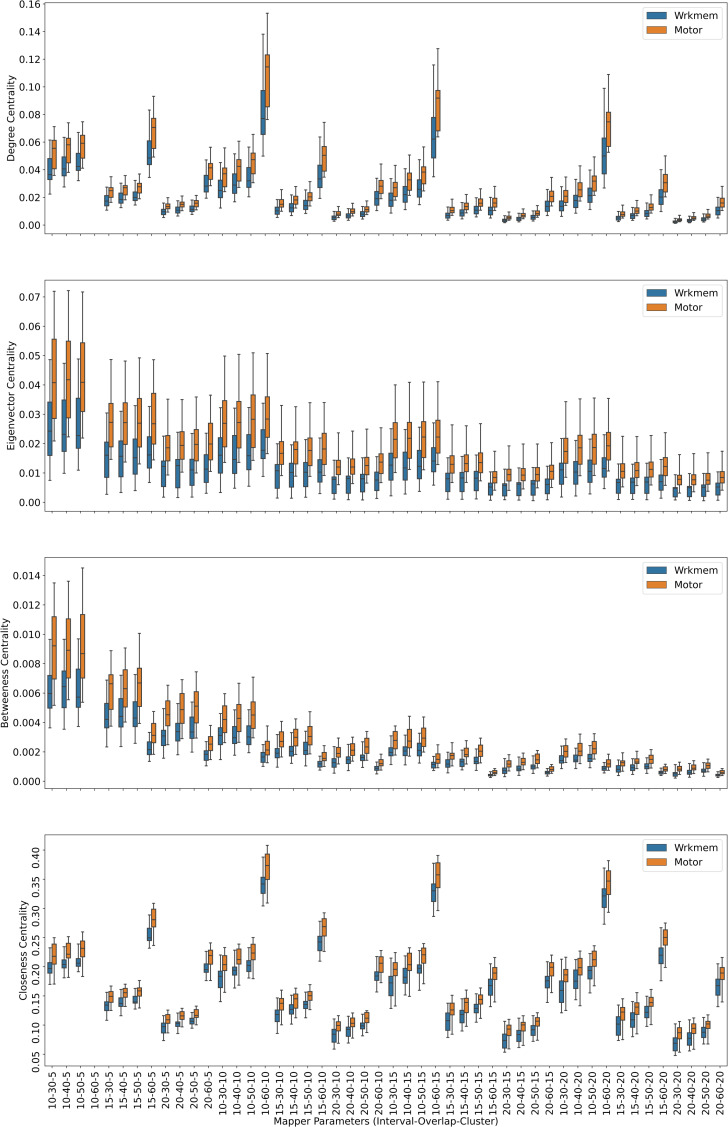
Figure 3. Working memory vs. Sensory-motor.
Box plots showing (from top to bottom) the degree, eigenvector, betweenness, and closeness centrality scores of the nodes of the Mapper graphs under different parameters. Parameter (10 − 60 − 5) is missing due to high complexity of the calculations and the limitations of our workstation.

